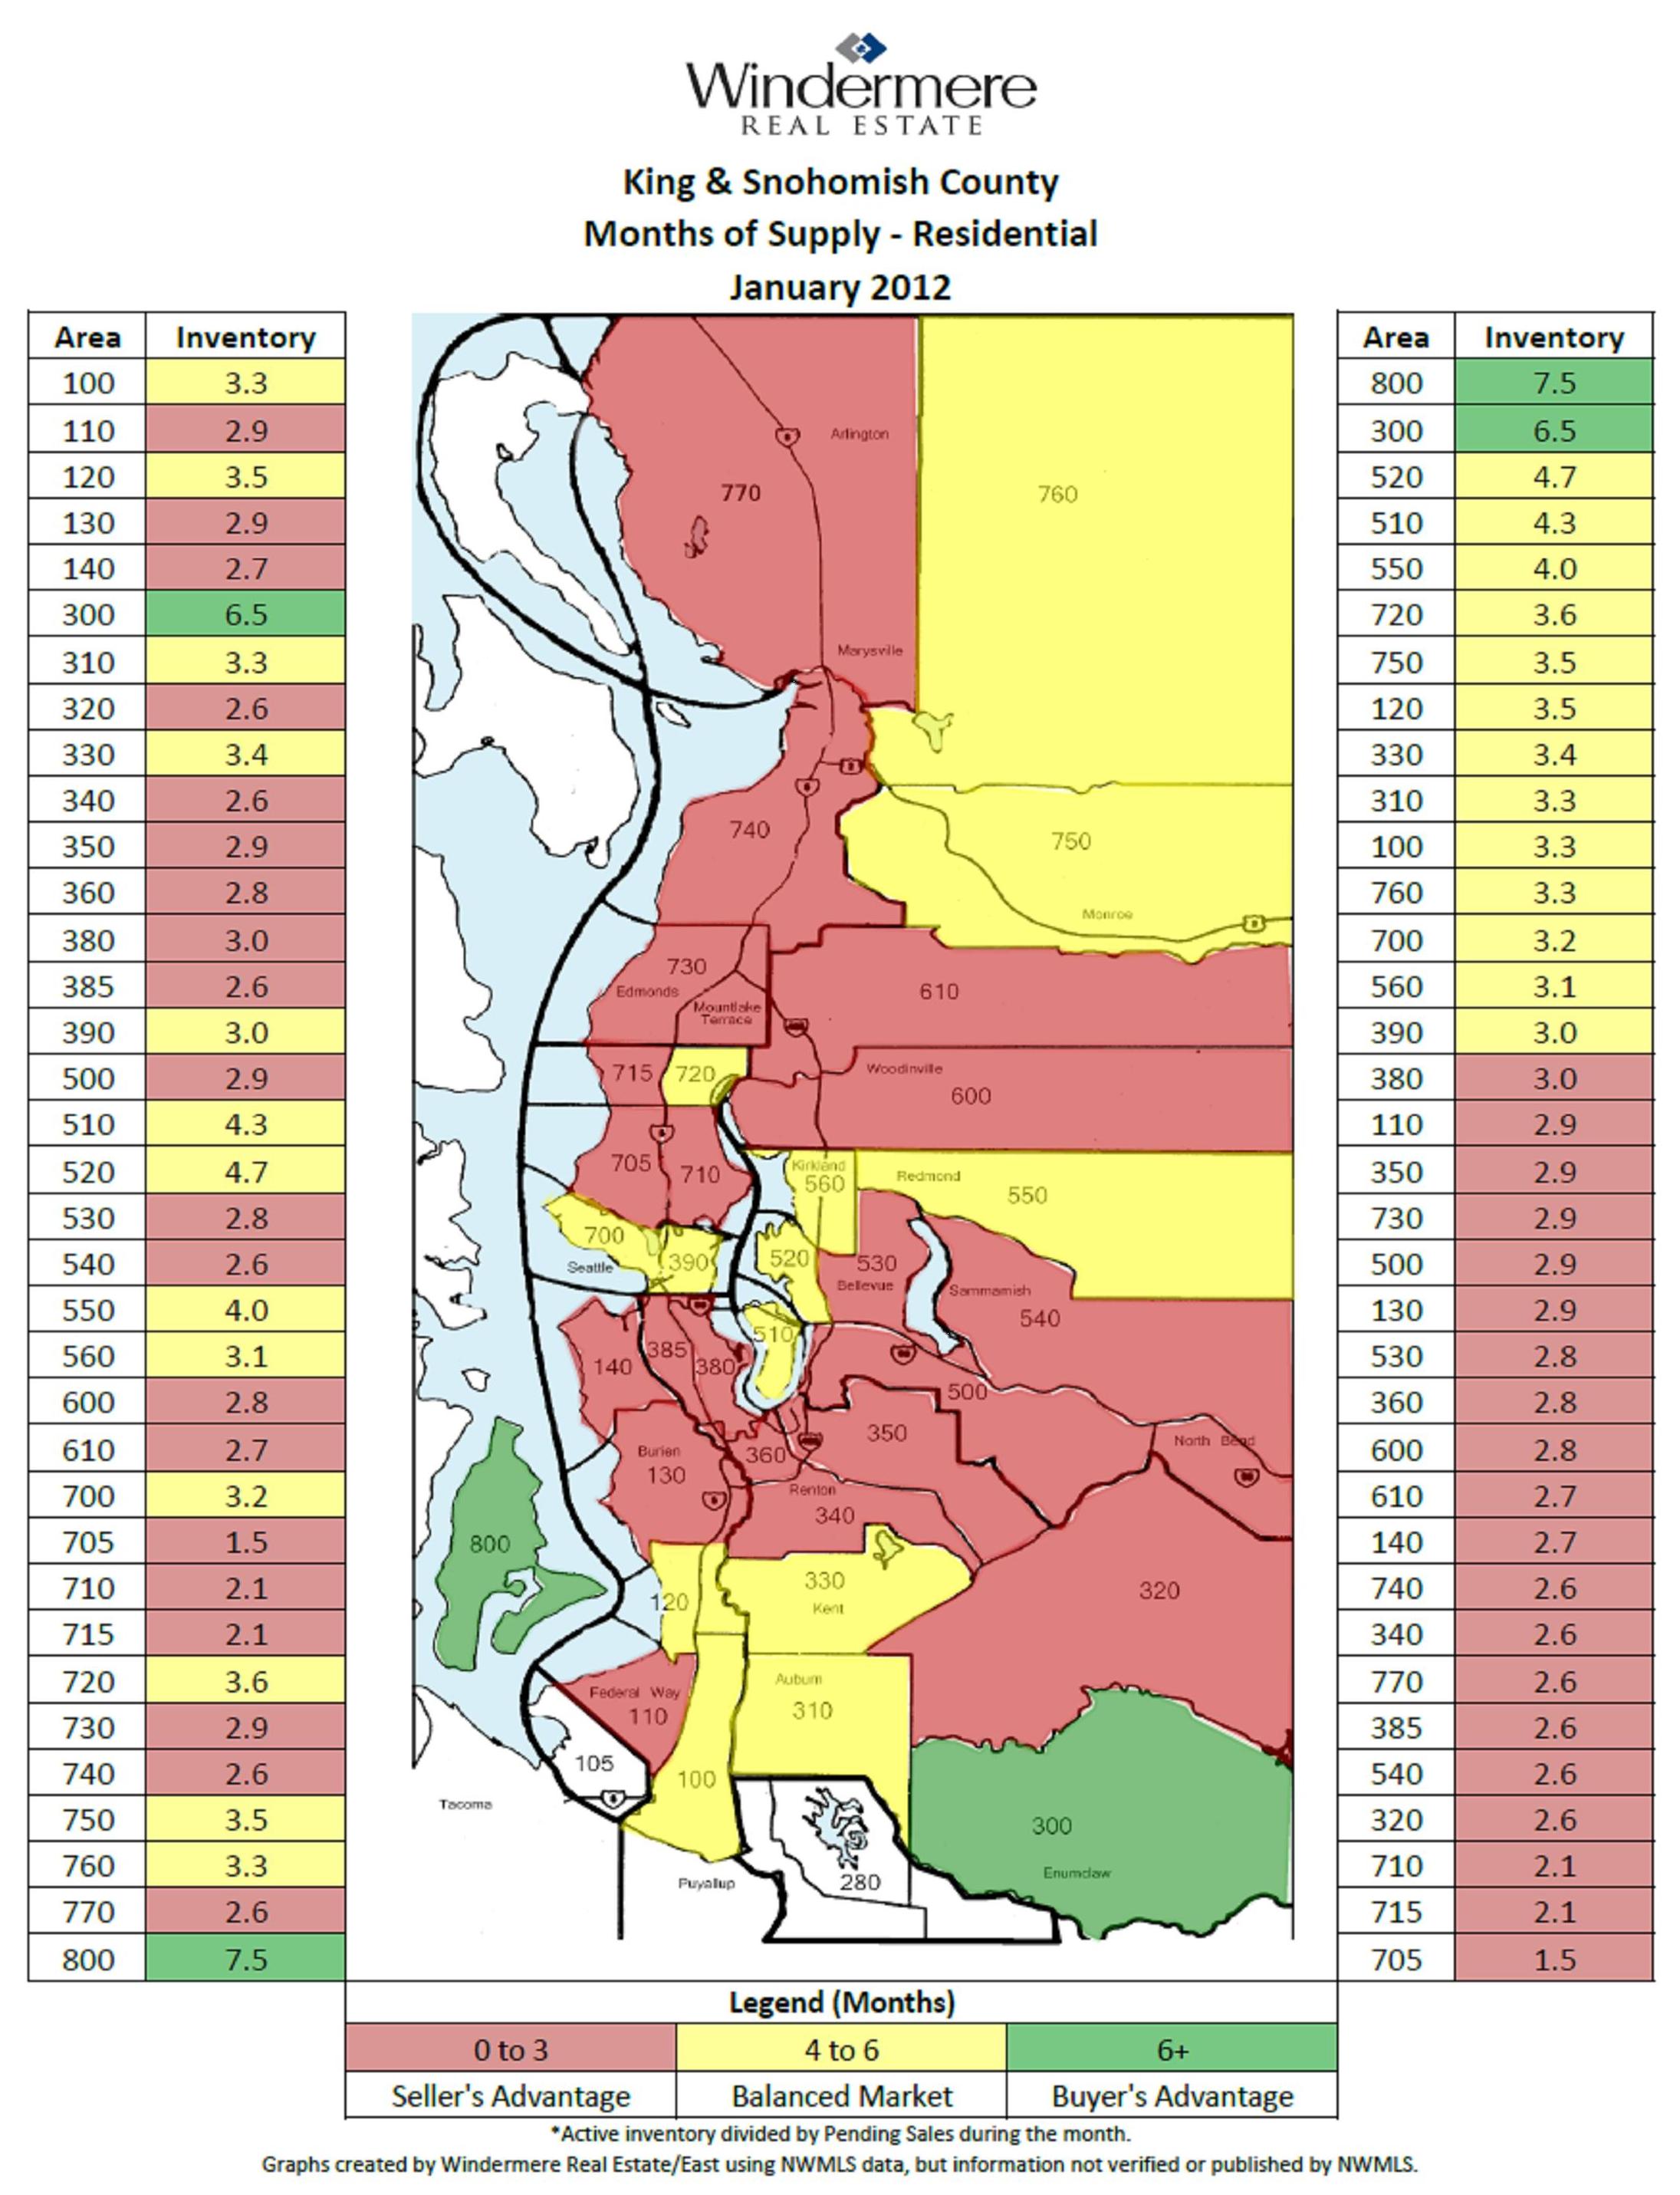
There’s a lot of “red” on the above Seattle area real estate map! There’s more “red” than we’ve seen in years, and I mean years. What does the “red” mean? It means it’s a seller’s market. The homes that are in the “red” areas sell in less than 3 months on average. In January, most of the eastside was a seller’s market. Mercer Island, West Bellevue, and Kirkland did not quite reach the threshold of a seller’s market, but Kirkland was almost there. The real estate markets in these areas were more evenly balanced between the buyers and sellers as homes sold on average within 3-6 months.
This real estate market is pretty exciting to see after the tough markets of the last few years. But what this really means is that we have a more normal market on Seattle’s eastside. The good homes that are priced right and show well are the homes that are selling quickly and bringing the average market time down. There are and still will be homes that aren’t priced well or don’t show well which will sit on the market and take longer to sell.
The chance of a home selling in the different eastside cities ranged from 15-30%. West Bellevue had the fewest sales when compared to the number of available homes, while the plateau cities of Sammamish, North Bend, and Fall City saw almost a third of the homes sell in one month!
But King County is a big place, and the real-estate market isn’t the same in SeaTac as it is in Sammamish.
A closer look at the statistics reveals significant variations from neighborhood to neighborhood.
It’s good to see the Times recognizing the neighborhood differences, since too many times the media publishes data, which covers too broad an area. This does not give an accurate picture of the real estate data.
How was real estate market in your Seattle-Eastside city in January, 2012?
1. The plateau: Sammamish, Issaquah, North Bend, and Fall City
The odds of selling a home were 30%
Median sales price decreased from $496,000 to $465,000 (y-o-y)**
There were 469 homes for sale
A total of 86 homes sold
Days on the market: 123
2. South Bellevue/Issaquah
The odds of selling a home were 28%
Median price decreased from $575,000 to $484,000
226 homes were for sale
A total of 35 homes sold
Days on market: 90
3. Kirkland
The odds of selling a home were 27%
Median sales price decreased from $534,000 to $522,000
155 homes were for sale
A total of 34 homes sold
Days on Market: 62
4. Redmond/East Bellevue
The odds of selling a home were 26%
Median sales price increased from $380,000 to $460,000
125 homes were for sale
A total of 32 homes sold
Days on the market: 94
5. Woodinville/Bothell/Kenmore/Duvall/North Kirkland
The odds of selling a home were 25%
Median sales price decreased from $390,000 to $344,000
387 homes were for sale
A total of 64 homes sold
Days on Market: 115
6. Redmond/Education Hill/ Carnation
The odds of selling a home were 21%
Median sales price decreased from $522,000 to $483,000
193 homes were for sale
A total of 30 homes sold
Days on Market: 112
5. West Bellevue
The odds of selling a home were 15%.
Median sales price increased from $650,000 to $1,230,000
118 homes were for sale
A total of 18 homes sold
Days on Market: 86
If you’d like more specific information about your neighborhood or home, feel free to contact either Brooks or me.
*(The odds of selling a home in each area is a result of the number of homes for sale divided by the actual number of home sales, so if 10 out of 100 homes sold, the odds of selling would be 10/100 or 10%)
** (y-o-y) median pricing is comparing year over year numbers.
 Facebook
 Twitter
 Pinterest
 Copy Link
