Did July’s Real Estate Prices Really Go Up By 7% on Seattle’s Eastside?
The Seattle media had screaming headlines recently about the 7% increase in King County real estate prices this July when compared to last July. Were the newspaper headlines right? As I've mentioned before, yes and no.
What did the media get correct when they said prices had gone up from July, 2011 to 2012?
They were only comparing the sales from July, 2011 to July, 2012. The median price was based on the sales that happened only in those two months. This could mean more expensive homes sold in 2012 than in 2011 or it could mean prices were higher. It is hard to know based on this one month. A snapshot of one month's real estate sales does not make a trend. It only shows how sales compared for those two months, so the Seattle Times was correct in stating the prices had gone up in from July, 2011 to 2012 by 7%. However, this is not the full picture.
How can you more accurately tell if real estate prices are going up, down or staying the same?
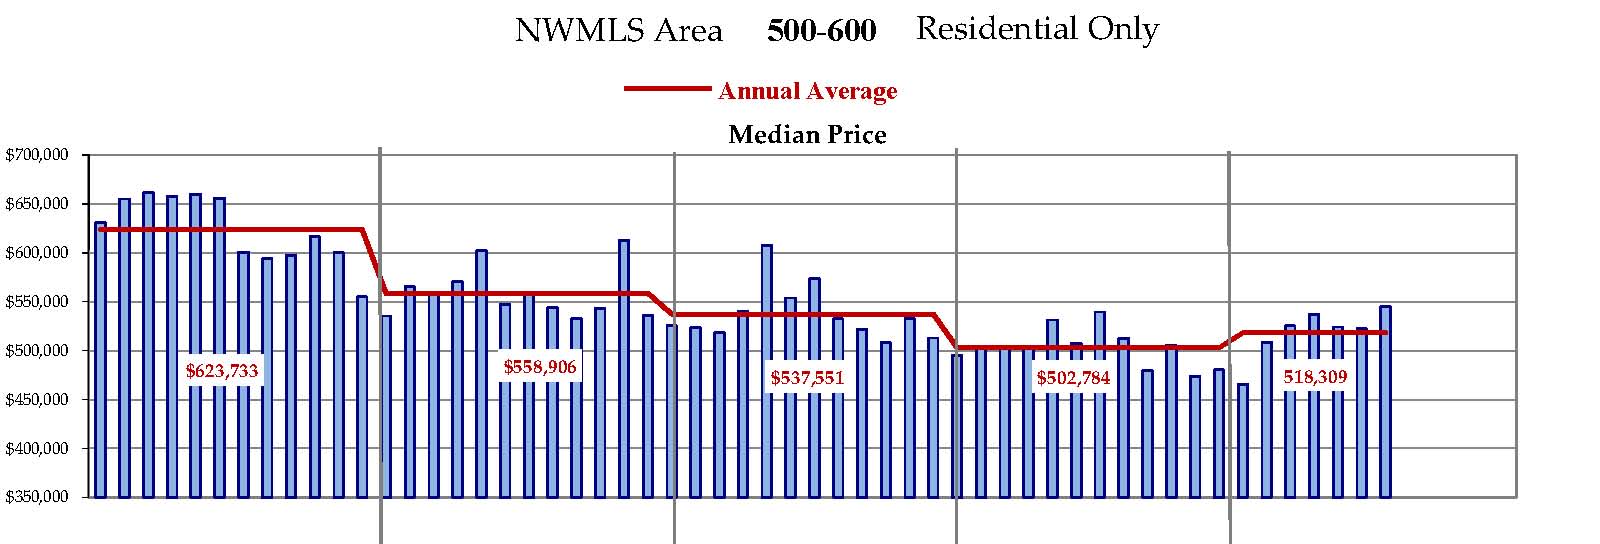
It's important to look at a pattern for a period of time, such as you can see in the chart above.
What does the chart show?
The chart is a compilation of all the home sales on the eastside, including such cities as Bellevue, Kirkland, Redmond, Woodinville, Sammamish, Issaquah and more. The NWMLS (Northwest Multiple Listing Areas) for these eastside cities are represented by area numbers 500-600 displayed at the top of the chart.
Windermere Real Estate compiled the data from each month and developed this chart to show median pricing for the past 5 years. If you look at the bottom of the chart, you'll see the years 2008-2012. Each blue bar above the years represents a month during each of the years. The red line going across the chart shows the median price point for each year. It was highest in 2008, when the median pricing for the year stood at $623,733 and had gone down consistently through the end of 2011, when the median pricing for the eastside stood at $502,784.
This year the chart shows the median pricing is creeping up, but here on the eastside and in other parts of King County, it's not up by 7%, but by about 3% so far for the year. The median for this year is at $518,309.
This is a much more accurate picture of real estate values on the eastside, not just a measure of one month's sales. Are you seeing similar trends in your area?
If you have questions about the value of your home, please feel free to contact us and we can take a closer look at the data for your home.
 Facebook
 Twitter
 Pinterest
 Copy Link
