How Many Homes Sold for More Than Full Price on Seattle’s Eastside?
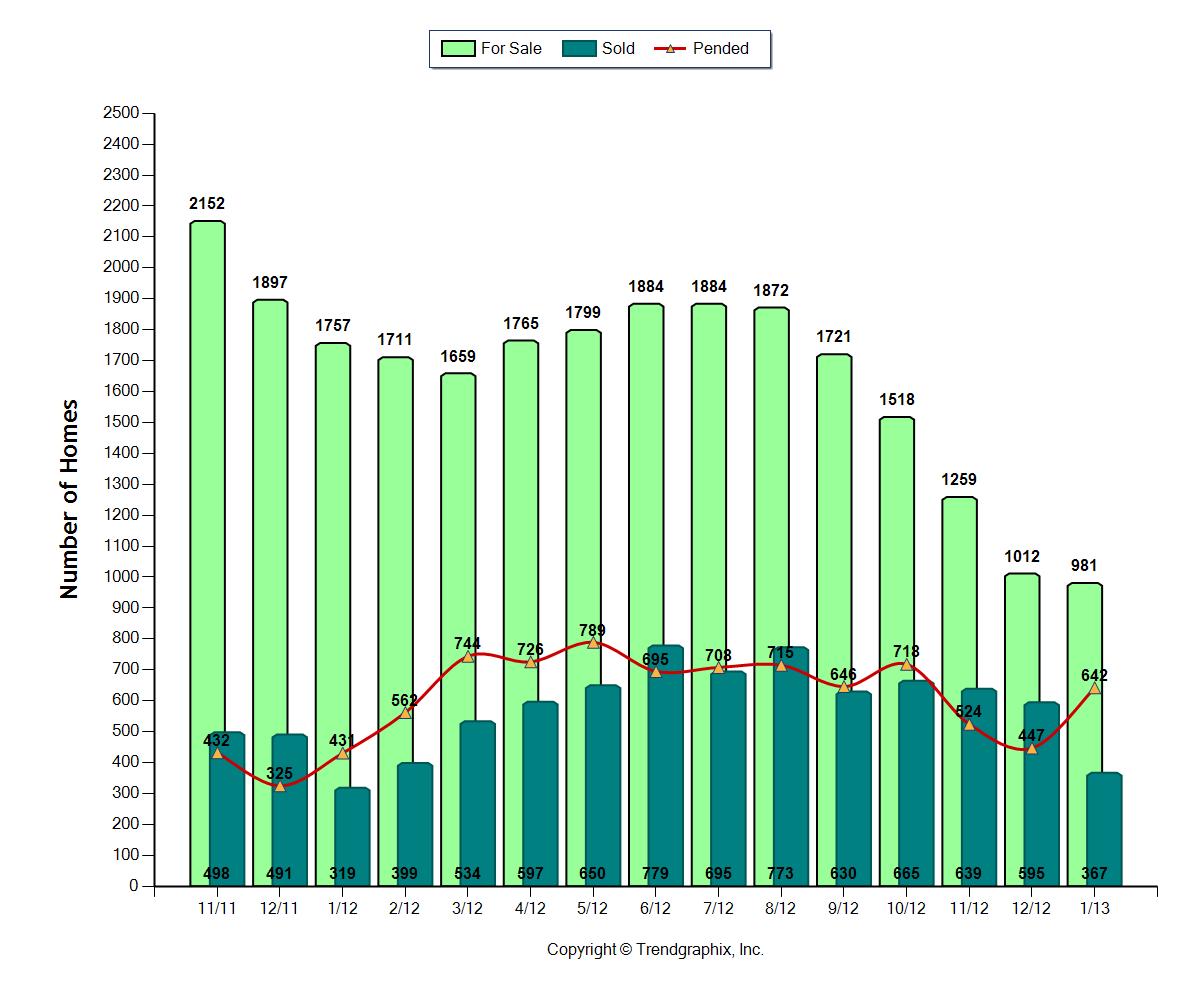
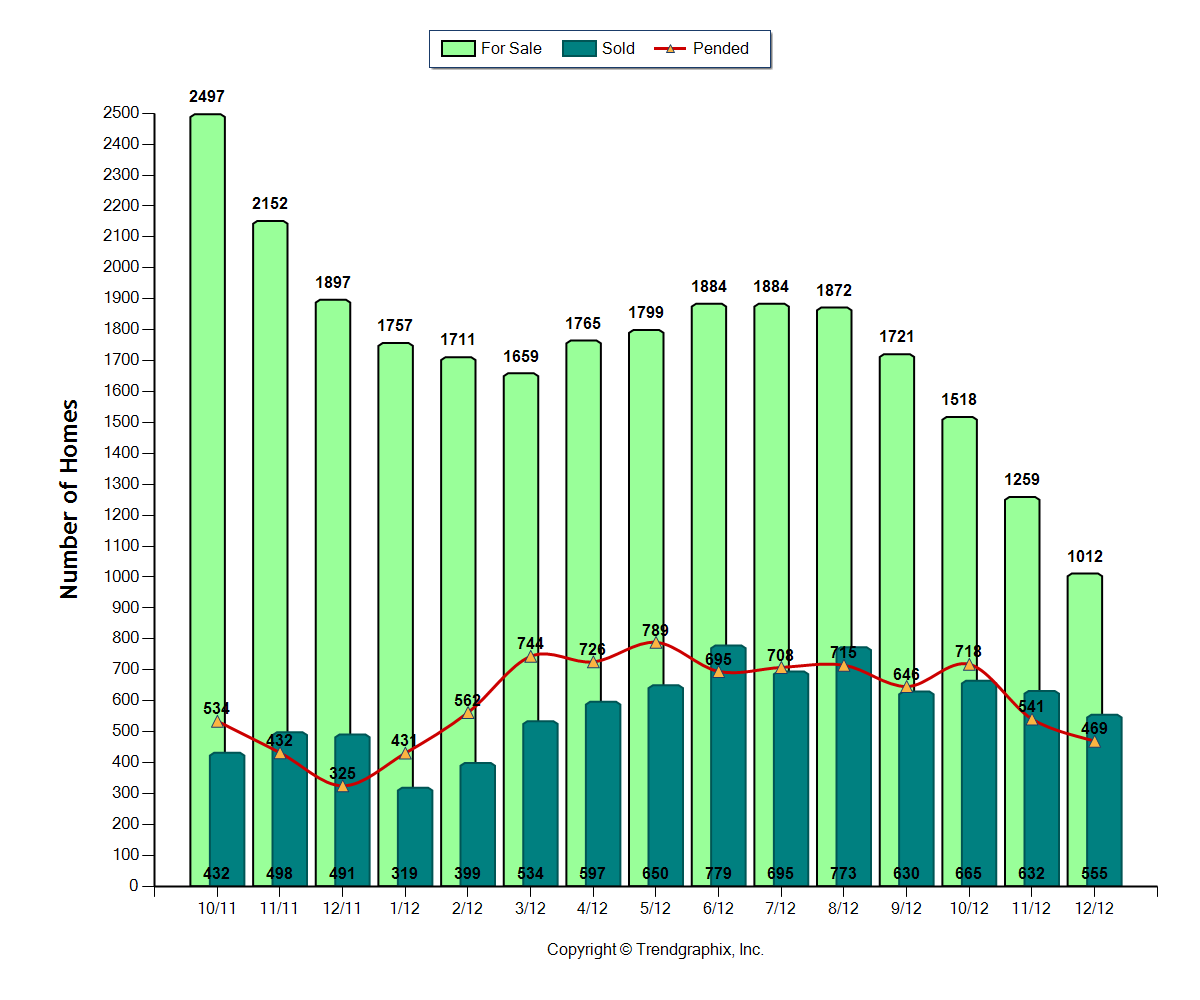
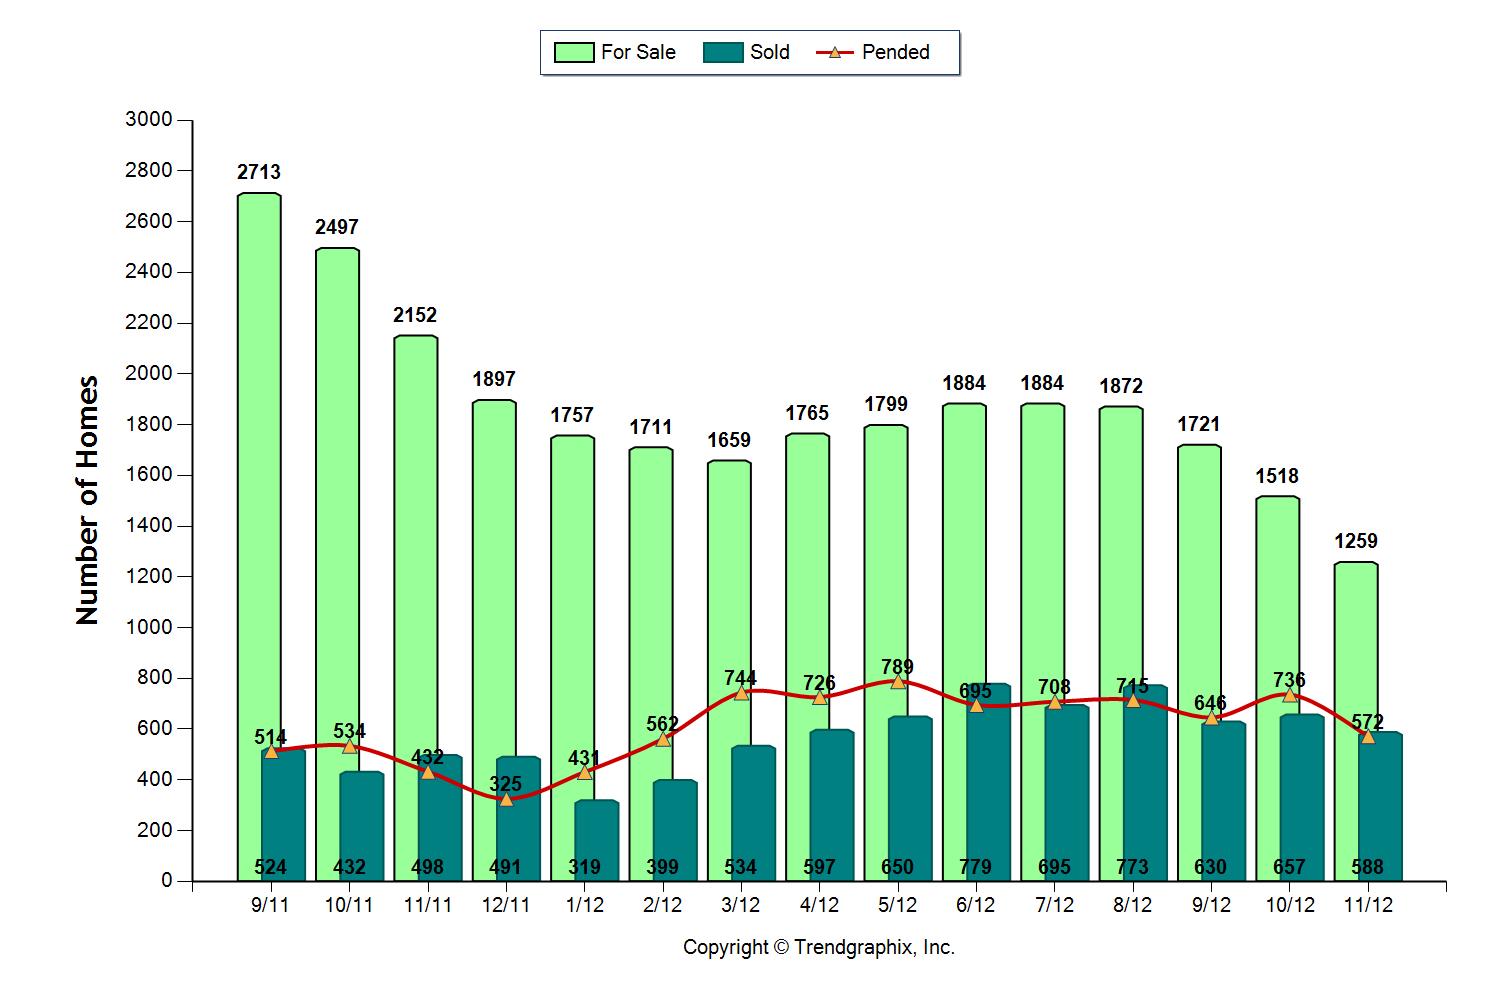
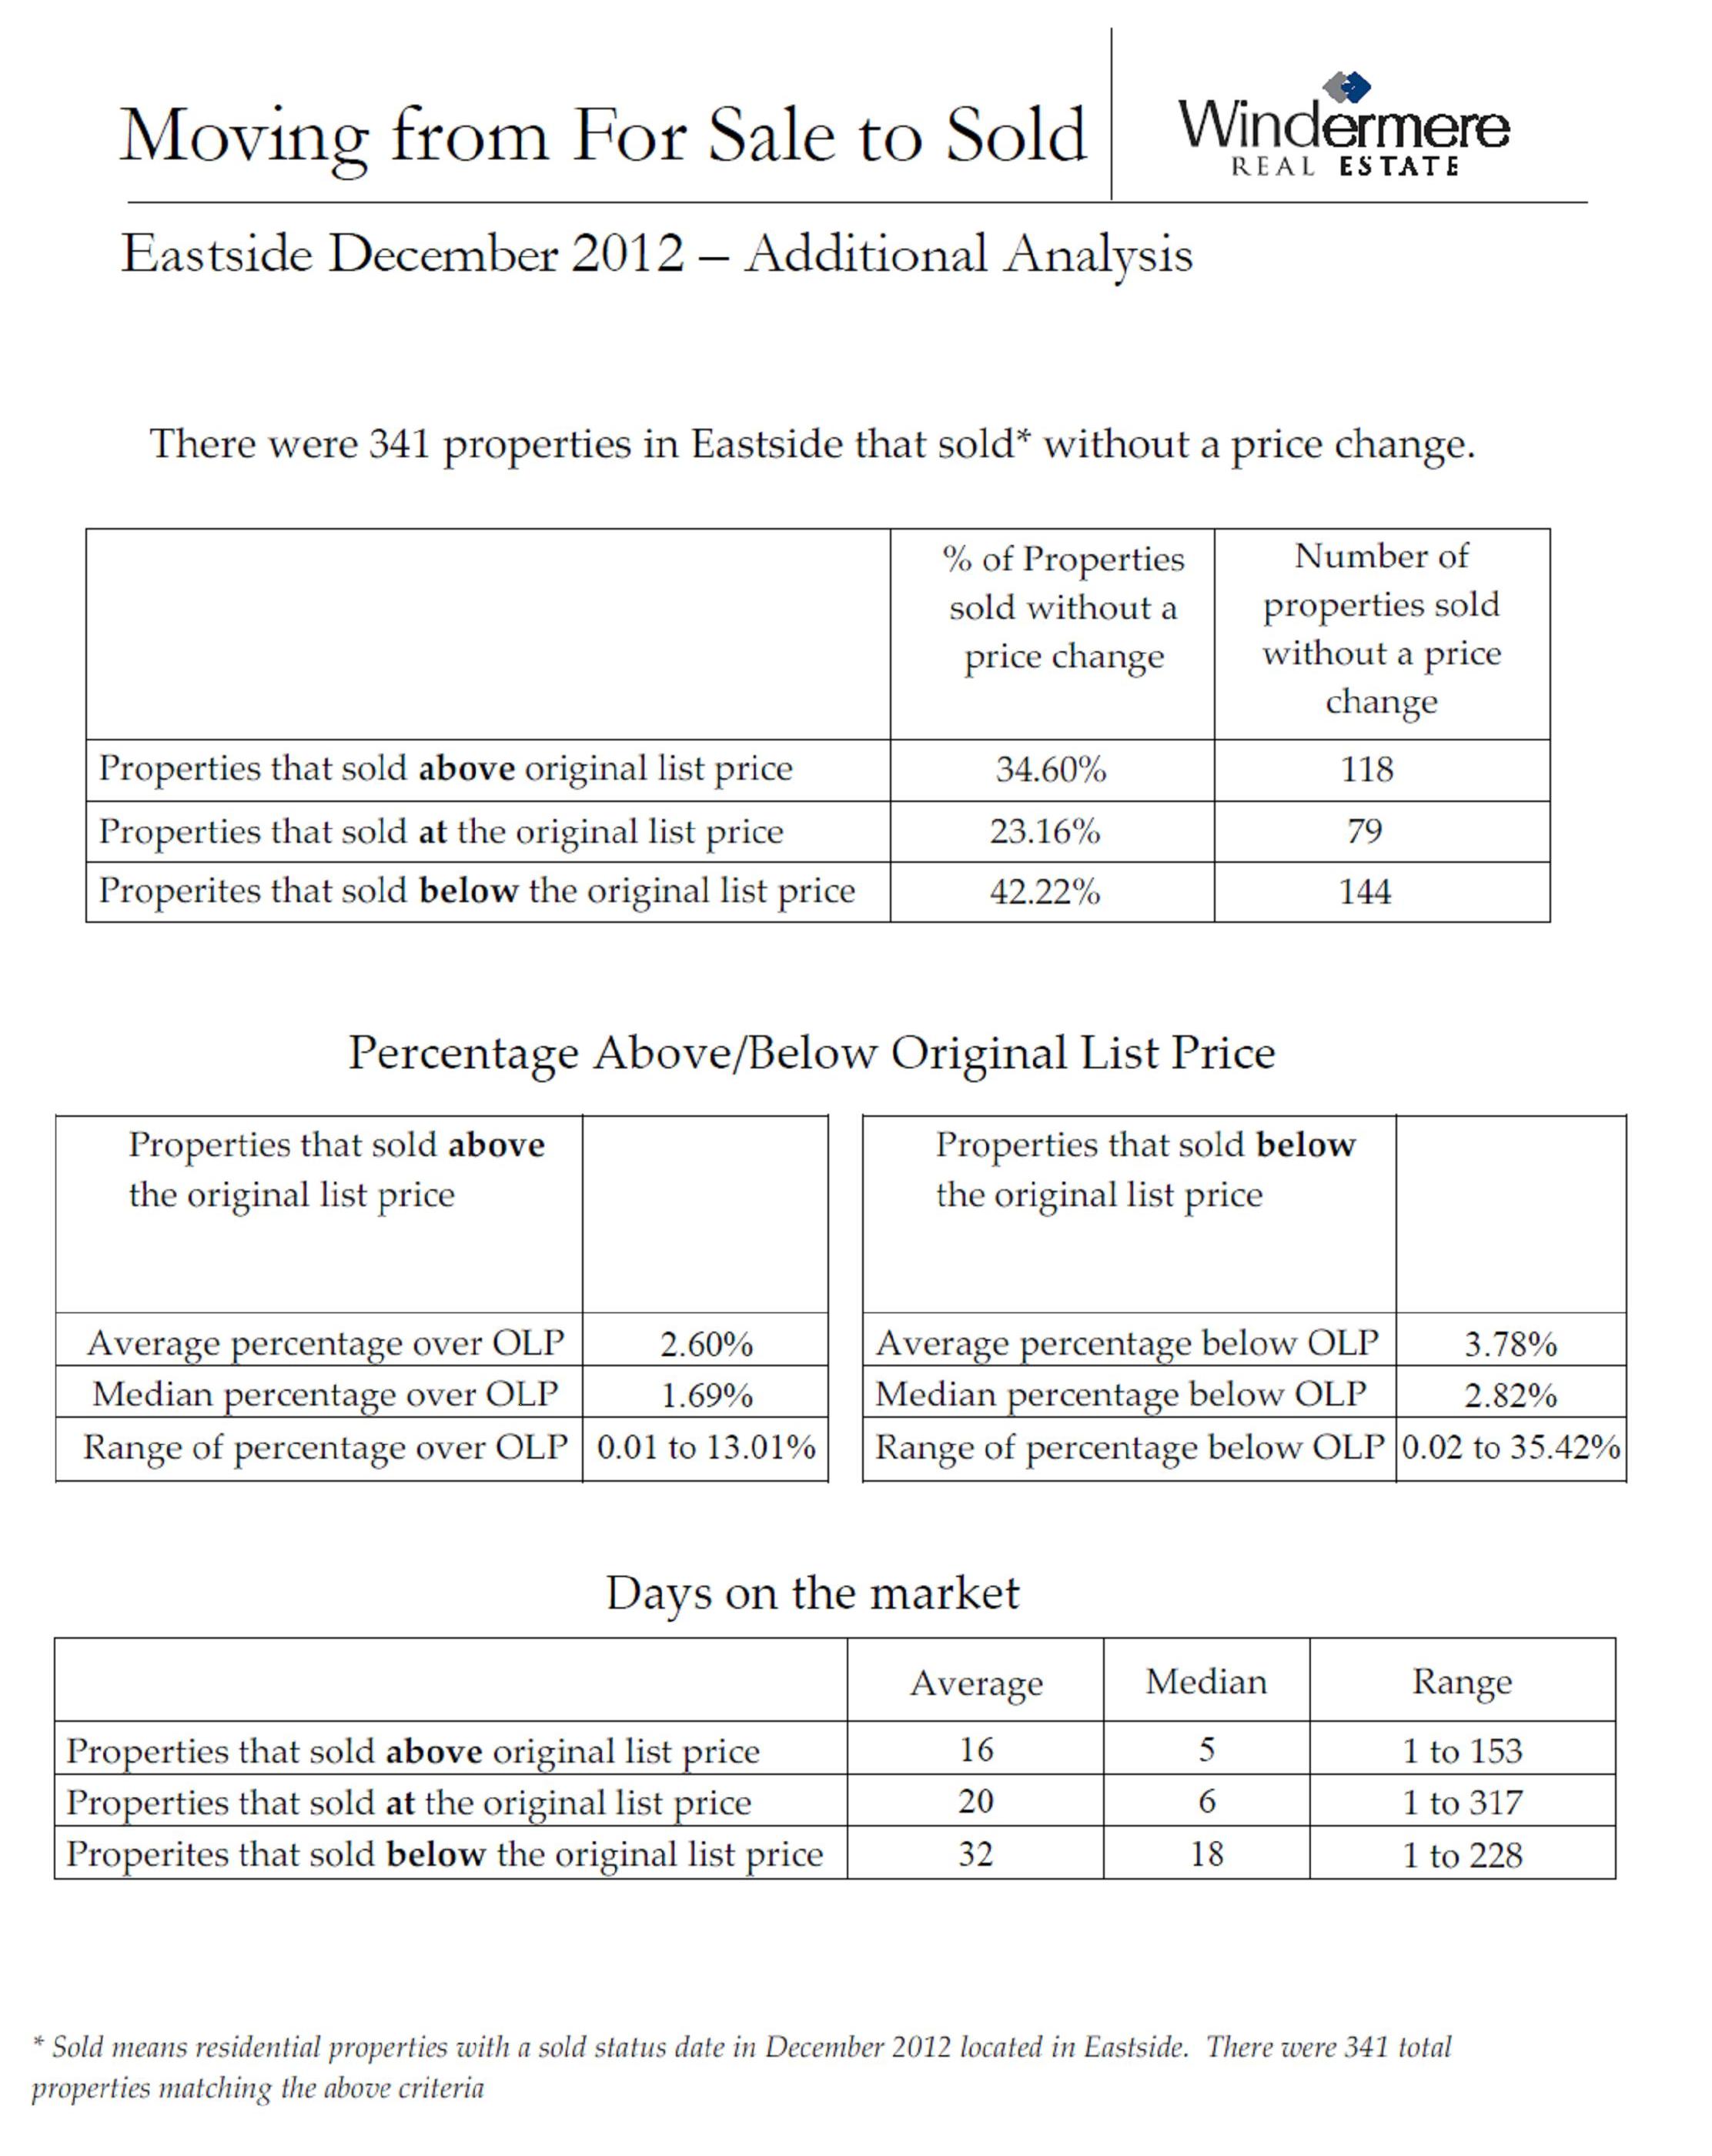 What a difference a year makes! Who had any idea a year ago that 1/3 of the Seattle Eastside homes that sold in December, 2012 would sell for over full price? No one anticipated the lack of inventory, the level of competition, and the subsequent increase in prices. The market picked up steam on the eastside as the year progressed. The trend became apparent as each month had buyers clamoring for homes and fewer and fewer coming on the market. The year finished with a fabulous sales record. One third of the homes sold for over full price, 23% sold for full price and 42% below full price.
Market time dropped to record lows as homes were snapped up. The homes that were well priced and in great condition are those that sold for more than full price.
We start out 2013 with these positive trends in the marketplace. Expect it to continue!
Many Homes on Seattle’s Eastside Are Selling For Over Full Price!
In the third quarter of 2012, almost 30% of the homes that sold in the cities of Bellevue, Redmond, Kirkland, Sammamish, Woodinville, Issaquah sold for over full price! The demand by buyers for homes and the lack of inventory is creating this huge uptick in competition for a home. When more buyers are competing for the same house, the offers often have to be for more than full price to stand out from the competition. Many homes are now getting multiple offers and many, almost a third, are now selling for more than the asking price.
We've recently sold several listings in which the selling price was over $20,000 more than the asking price! In one instance, the home had come on the market only hours before. The buyers didn't want to take the risk that another offer would be written before the seller had time to respond, so they offered over full price. Another home sold within 48 hours. Three buyers made offers for that home.
As you can see in the above chart, the homes that sell for more than full price, sell for about 3% above the asking price, with the range from just a hair over asking price all the way to 22.5% above the asking price!
Twenty-one percent of the homes sold for full price. This means 51% of the homes on the eastside sold for full price or more!
The homes that sold above full price only lasted on the market, on average,16 days. Homes that sold for full price were on the market for about a month.
But what about the other 49%? (Not to be confused with the 47% that was talked about in the election)
Why did half the homes sell for less than full price if the market is so hot? More than likely, one of these reasons was the cause:
- Location
- Pricing
- Condition
- Marketing
- Competition
You can't change the location or the fact that there is competition for a particular home. But when selling a home, you need to maximize your buyer attraction by pricing your home well, having it in stellar condition, and presenting it well to the buyers through fabulous marketing.
If you have questions about how to have your home be one of the 51% that sells for full price or more, feel free to contact us!
Should You Put Your Home on the Market on Seattle’s Eastside During the Holidays?
Yes, yes, yes!
You should put your Eastside-King County house on the market now and I'll tell you why:
First, here are the "market" reasons:
We have one of the lowest number of homes for sale and the highest number of sales in the last 15 years!
In October, the last month in which we have statistics, there were 1,821 homes for sale, which was 45% less than October, 2011! There were 67% fewer homes for sale than in 2008!
October had the most Eastside pending sales (1,202) of any October in the last 15 years! The average number of October sales for the has been 867 home sales, which means this October was 39% higher than the 15 year average!
With these high sales numbers, buyer demand is unusually strong for this time of year.
Emotional/personal reasons:
There are a lot of buyers out there who are jumping on homes to buy the minute they hit the market. We know because that just happened for one of our sellers. The home was gone in a matter of hours.
Because most people don't think it's a good time to put your home on the market, it's exactly the right time to do it. Most sellers will wait until after the first of the year, but there's less competition during the holidays.
Buyers are worried they won't find a good home if they wait too long. Buyers are out there and making offers to buy homes.
Homes are warm and inviting during the holidays. This is the time of year when people feel like "nesting" at home. A cozy home only supports the feeling. The holidays bring rise to all kinds of homey feelings.
Many homes can actually show better during the holidays. Homes are nicely decorated, making the home feel more warm, colorful, and personal.
If you're planning to sell your home in the next 6 months, rethink your plan and consider going on the market during the holidays. Happy Holidays! (And it that doesn't work, then get on the market early in the year!)
October, The Best Month to Sell a Seattle Eastside Condo in 5 Years?
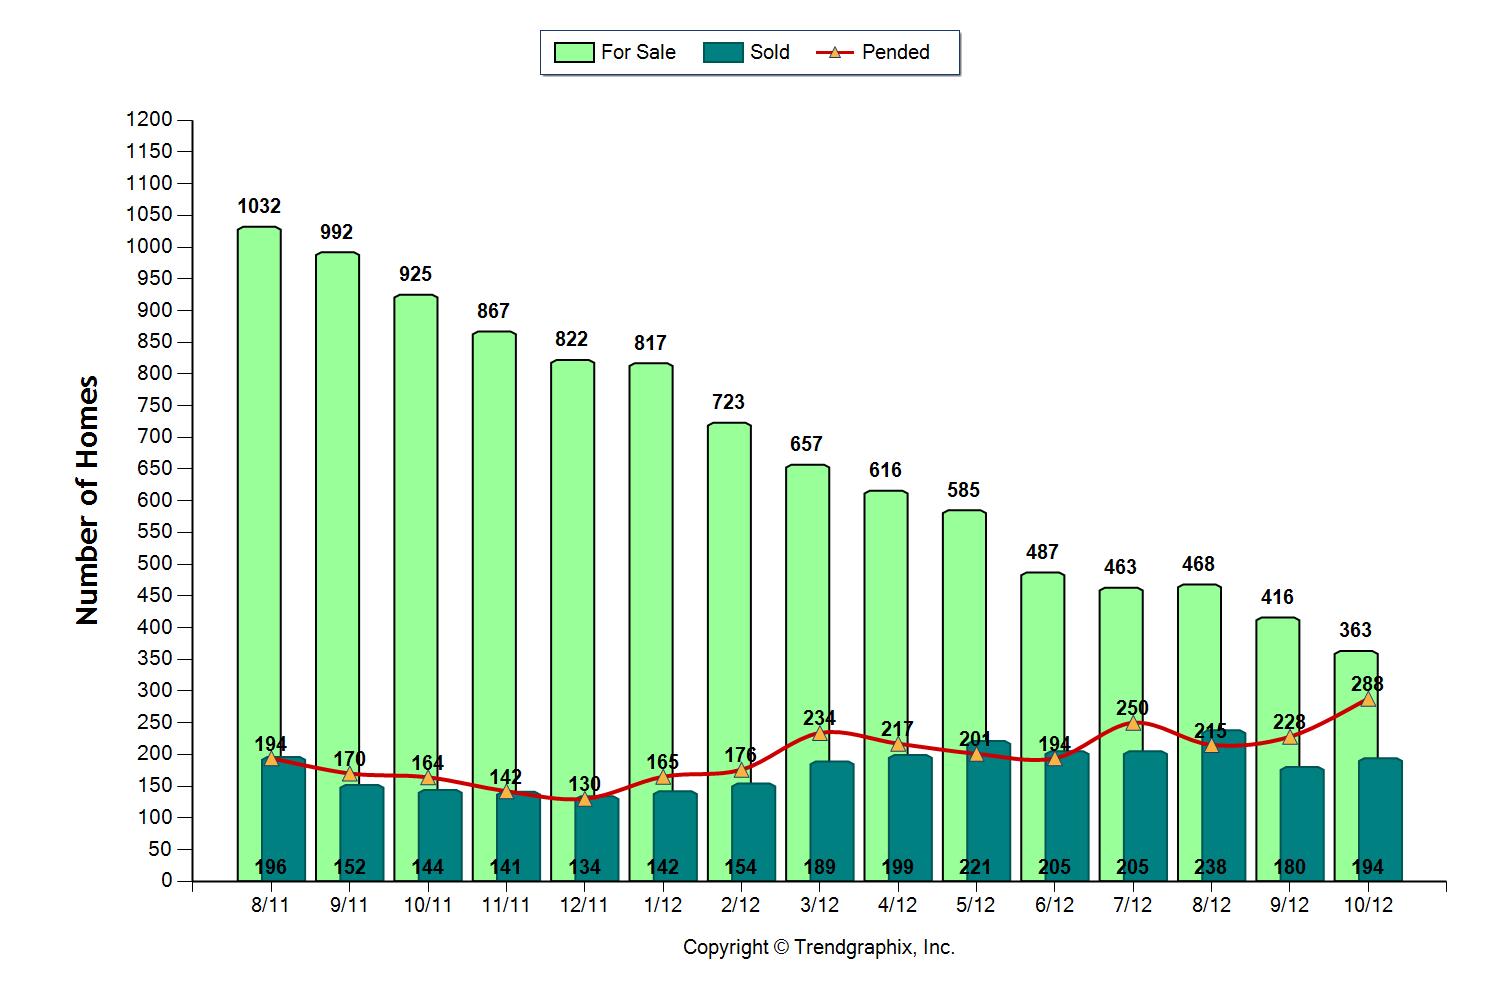
When 288 condos out of 363 sell in a month, the odds are incredible! In fact, the chances of selling your condo in October was 79%!
With the low supply of condos for sale, prices are rising. Phew! It's so good to be able to say that.
Because there's still a number of foreclosures and many condo owners are underwater, expect the supply of condos continue to be limited. Expect the stronger market to continue into 2013.
My tips for people in the condo market remain the same as last month, so here goes:
What does this all mean if you are thinking of selling or have your condo on the market?
If your condo takes a long time to sell, then it is either overpriced or is not marketed well. Make sure your condo has great online photos to start. Staging can also be a big plus. Good pricing and great photos are the two most critical marketing pieces to getting your condo sold. Remember this is how buyers and other agents "see" your home first, so the pricing and online marketing are crucial to getting buyers through the door to actually see your condo and make an offer to buy it.
What does this all mean if you are a condo buyer?
This is the time to make a purchase. With the short supply, pricing should continue to increase. Remember, too, that interest rates are still incredibly low. Don't forget to check the financial viablity of an condo association you're thinking of buying into. In a blog post I wrote a few months ago, I listed some of the important things to look for when checking condos out. The post looks at the issue from the seller's point of view, but these issues should be important to any buyer. Fortunately for the buyer, the law requires a seller to provide the answers in the form of a resale certificate which is reviewed as one of the conditions of an offer.
If you have any questions about the condo market, please feel free to contact us.
Did July’s Real Estate Prices Really Go Up By 7% on Seattle’s Eastside?
The Seattle media had screaming headlines recently about the 7% increase in King County real estate prices this July when compared to last July. Were the newspaper headlines right? As I've mentioned before, yes and no.
What did the media get correct when they said prices had gone up from July, 2011 to 2012?
They were only comparing the sales from July, 2011 to July, 2012. The median price was based on the sales that happened only in those two months. This could mean more expensive homes sold in 2012 than in 2011 or it could mean prices were higher. It is hard to know based on this one month. A snapshot of one month's real estate sales does not make a trend. It only shows how sales compared for those two months, so the Seattle Times was correct in stating the prices had gone up in from July, 2011 to 2012 by 7%. However, this is not the full picture.
How can you more accurately tell if real estate prices are going up, down or staying the same?
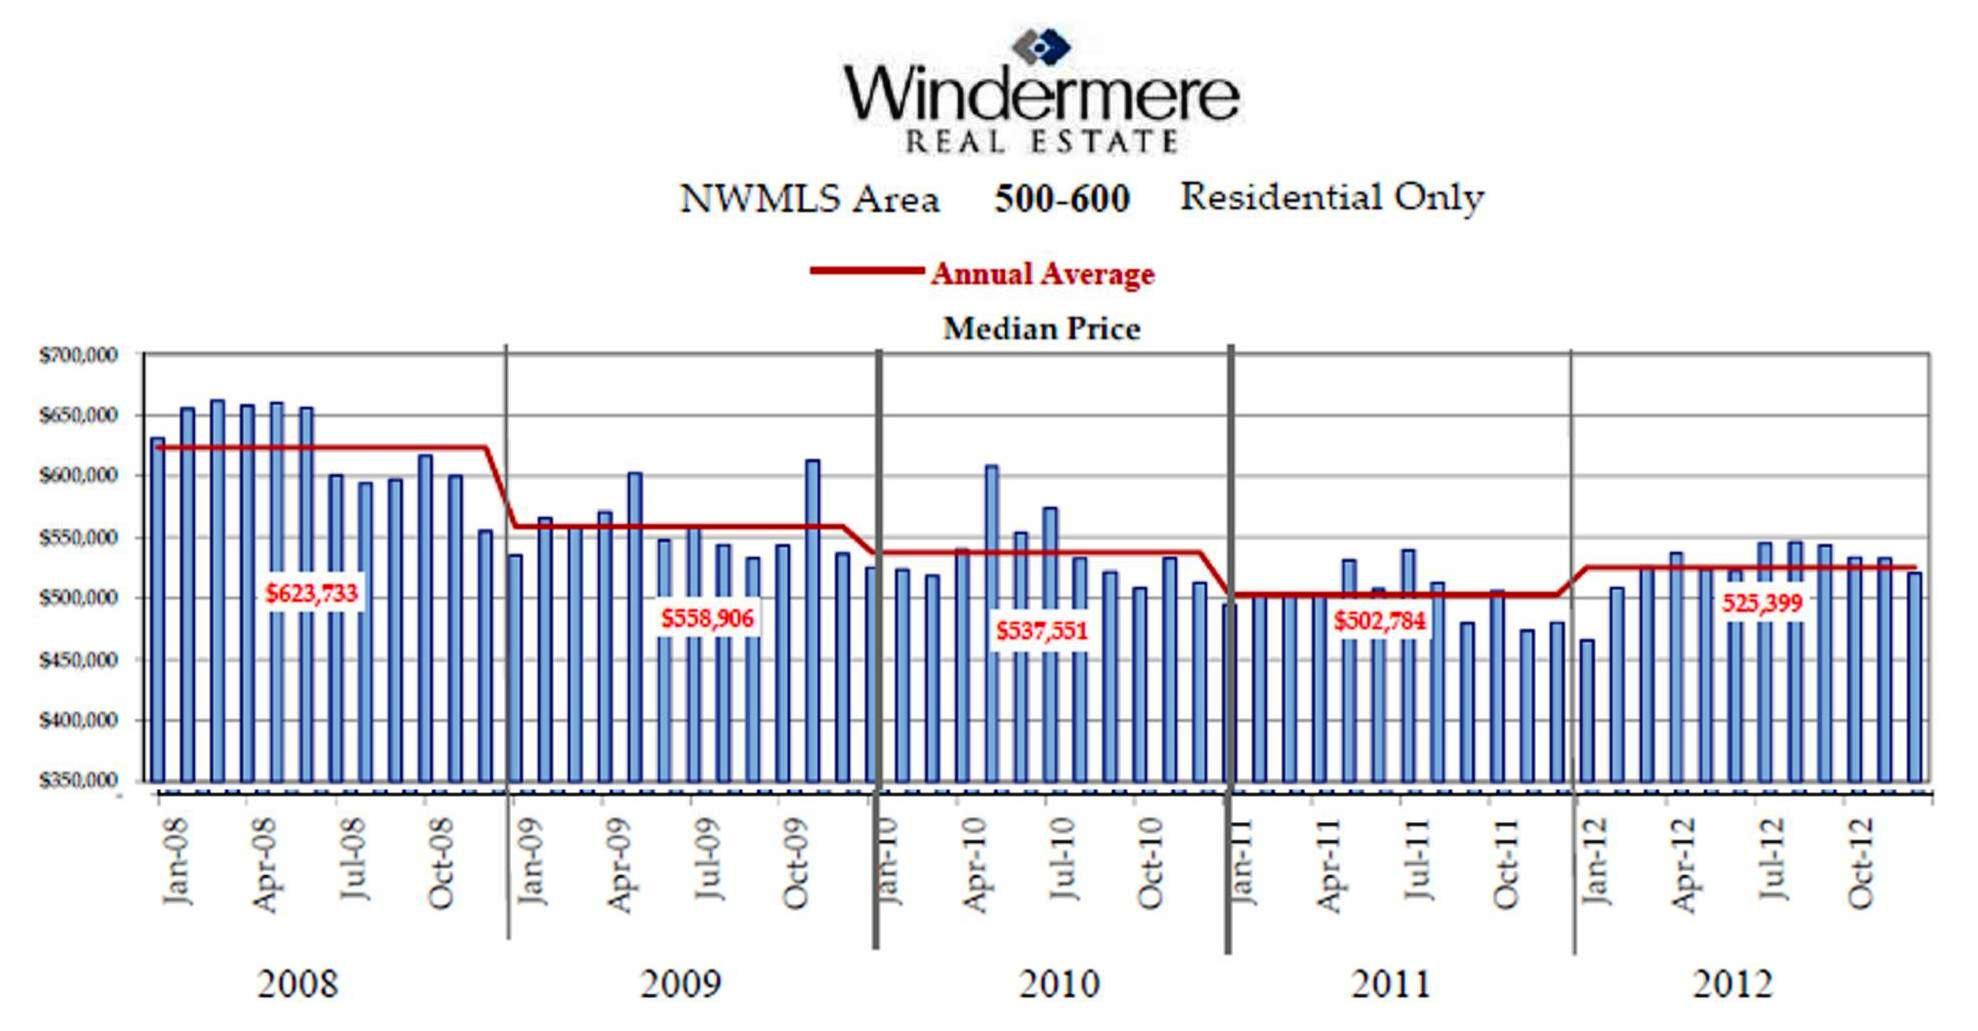
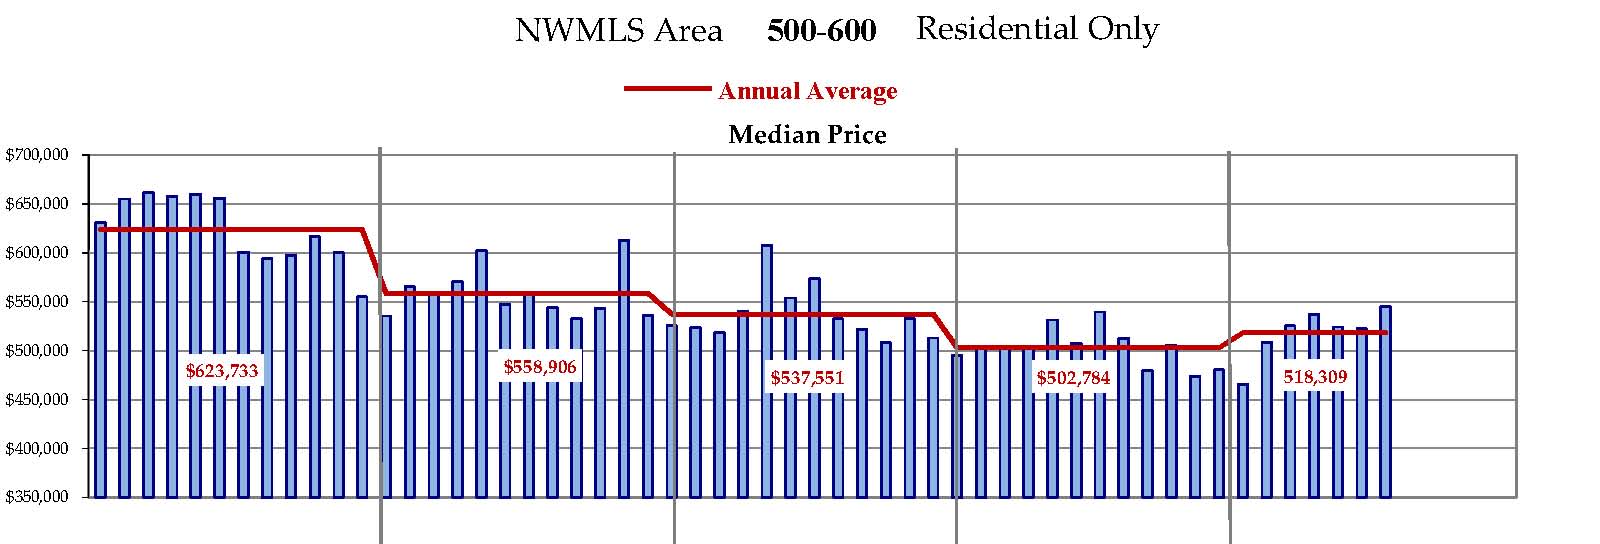
It's important to look at a pattern for a period of time, such as you can see in the chart above.
What does the chart show?
The chart is a compilation of all the home sales on the eastside, including such cities as Bellevue, Kirkland, Redmond, Woodinville, Sammamish, Issaquah and more. The NWMLS (Northwest Multiple Listing Areas) for these eastside cities are represented by area numbers 500-600 displayed at the top of the chart.
Windermere Real Estate compiled the data from each month and developed this chart to show median pricing for the past 5 years. If you look at the bottom of the chart, you'll see the years 2008-2012. Each blue bar above the years represents a month during each of the years. The red line going across the chart shows the median price point for each year. It was highest in 2008, when the median pricing for the year stood at $623,733 and had gone down consistently through the end of 2011, when the median pricing for the eastside stood at $502,784.
This year the chart shows the median pricing is creeping up, but here on the eastside and in other parts of King County, it's not up by 7%, but by about 3% so far for the year. The median for this year is at $518,309.
This is a much more accurate picture of real estate values on the eastside, not just a measure of one month's sales. Are you seeing similar trends in your area?
If you have questions about the value of your home, please feel free to contact us and we can take a closer look at the data for your home.
How Do You Go From For Sale To Sold on Seattle’s Eastside?
How do you get from “for sale” to “sold?” It’s the price! Even though the real estate market in Bellevue, Kirkland, Redmond and other eastside cities is red hot, the price is still critical to getting a “sold” sign posted on the “for sale’ sign in your front yard.
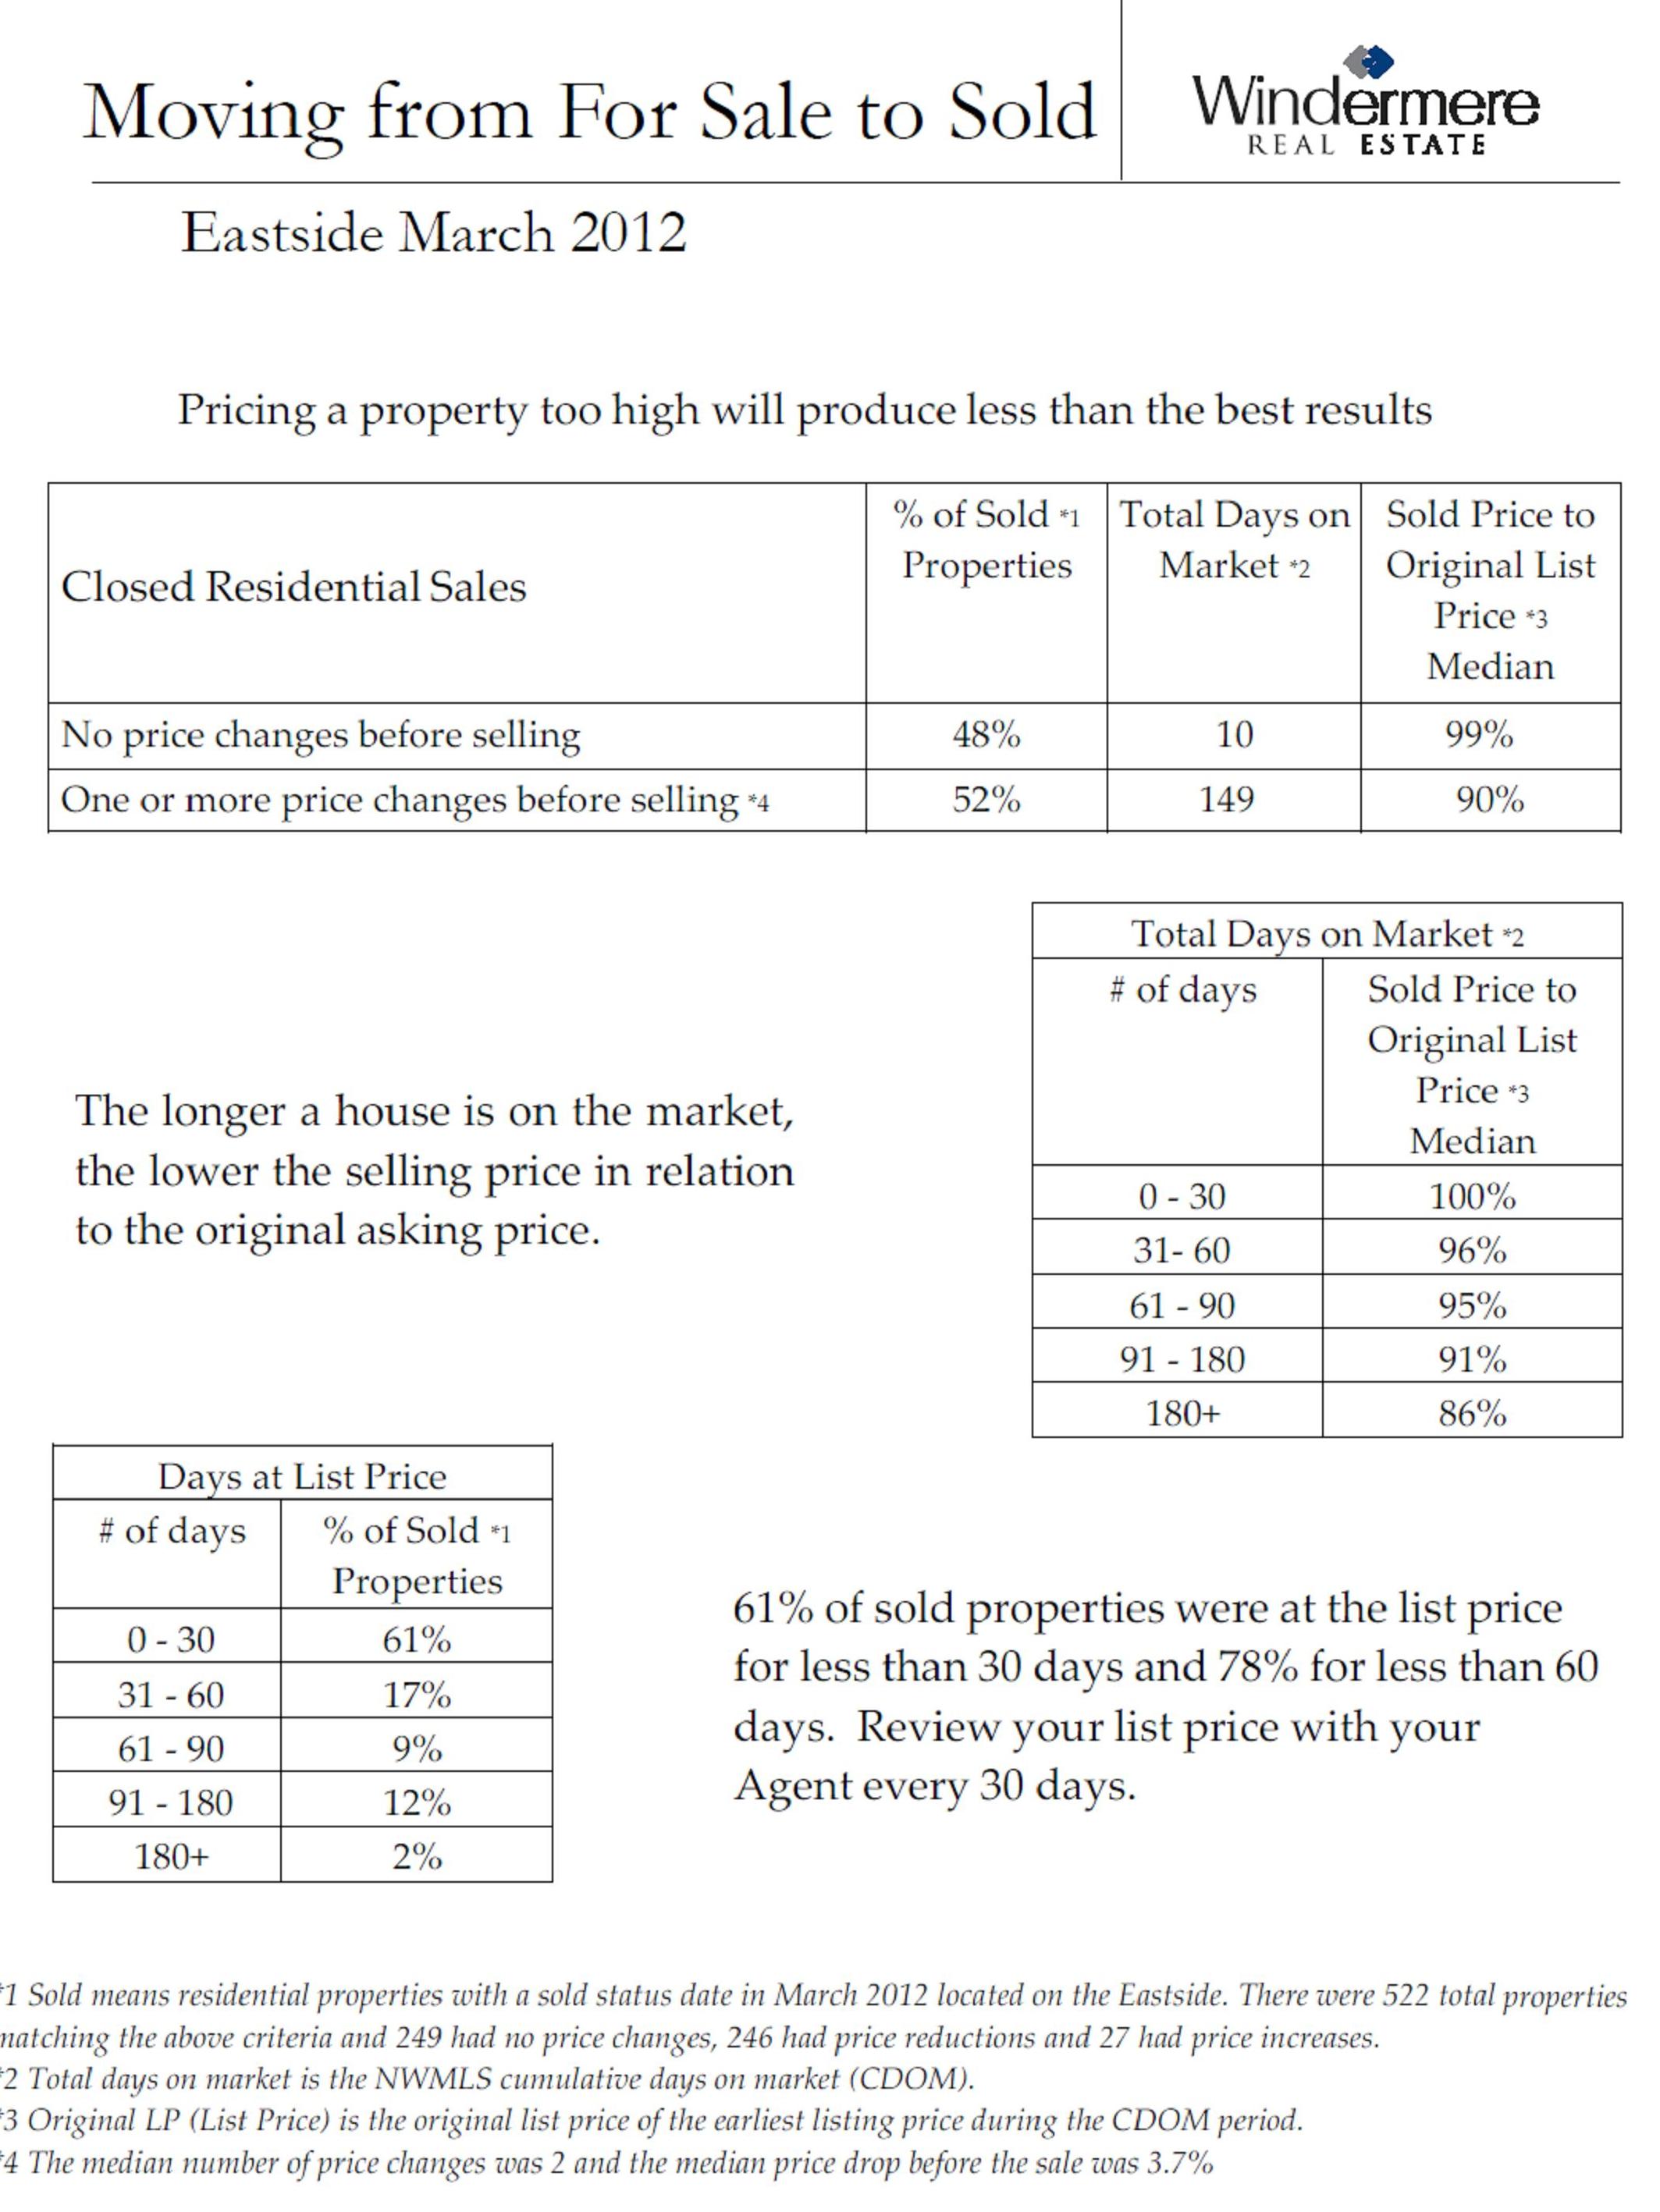
Almost half, 48%, of the homes for sale between September, 2011 and March, 2012 sold in 10 days or less! With these homes only on the market for fewer than 10 days, the homeowners and their Realtors did everything right. The homes had to be priced right, show well, have fabulous photos and great marketing or the homes would not have sold.
Seeing these incredible numbers should help blow several common misconceptions out of the water:
1. Should you leave negotiating room when you set the price for your home? NO. Some homeowners think they should leave bargaining room. This, however, will send that homeowner down a path toward a longer market time and a lower selling price. Look again at the top line of the first chart. Almost half the homes sold within 99% of asking price and in under 10 days. With sales prices coming in at 99% of the asking price, there was little bargaining in the final sales price.
2. What if you want to price your home high because you’re in no rush to sell? A homeowner who overprices a home will shoot themselves in the foot. Let’s say a buyer is out searching to buy a home and sees 5 homes. The buyer will compare each one’s price, location, and features. They don’t compare whether a seller is a rush to sell or has all the time in the world. The buyer won’t know that. The buyer will only know that when comparing the homes, the overpriced home will stand out. Most buyers don’t bother to make an offer because there are 4 other homes that are more attractive and priced right. There’s no need to waste time pursuing an overpriced home because, even though the supply is low, there are other homes on the market. If today’s market pricing doesn’t meet a homeowner’s needs, then don’t put the home on the market.
3. Were these homes underpriced, because they sold so quickly? No. In today’s real estate market, we’re dealing with very savvy buyers. They know the market and they know pricing. They know when they see a home that’s well priced and they’ll pay for it. The buyers don’t have time to waste. The good homes are going fast. Secondly, does anyone really think that half of the homes that sold in the last 6 months were underpriced? I don’t think so!
The other 52% of the homes took 149 days to sell and sold with an average of a 10% discount. If you look at the second chart, you can see for every 30 day period a home is on the market, the selling price drops. Homes that were on market for a long time were the homes in which sellers could bargain with the buyers, but it usually meant the price dropped. Buyers think a home is overpriced or there’s something wrong with it if the house is on the market for more than a month in this market.
If you decide to sell your home, you’ll need to decide in which half of the market you’d like to be. Do you want to be in the market in which your home could sell quickly and for a good price or do you want to test the waters, take your time, and more than likely sell for less? It’s your decision.
The Real Estate Sales Numbers in Redmond, Kirkland, Bellevue Continue to Be Fabulous
This tells it like it is in the Seattle area real estate market. The entire region, with the exception of Vashon Island in yellow, is a sellers market, which is indicated by the color red. The top sales rate, not the most sales, once again goes to Redmond and East Bellevue near Microsoft. In March, 80% of the homes sold there, while 69% sold in April! The odds of selling a home were the lowest in other parts of Redmond and Carnation. But at 32%, the odds were still good. This is a testament to the positive economy in the Seattle area and on the eastside.
Microsoft is hiring and moving people around the country. We know this first hand as we’re working with three different buyers who are either moving into the Bellevue/Redmond area or moving out of state for Microsoft.
Multiple offers, a shortage of homes, a huge percentage of homes selling in a short amount of time. some price increases (although minimal) are happening all over the Seattle eastside real estate market. The Seattle Times recently published a very positive picture of the local real estate market.
The cities below are reported together to follow our MLS areas (multiple listing service) information.
1. Redmond/East Bellevue
The odds of selling a home were 69%!!!!!
Median sales price decreased from $430,000 to $428,000 (y-o-y)**
97 homes were for sale
A total of 67 homes sold
Days on the market: 70
2. South Bellevue/Issaquah
The odds of selling a home were 48%
Median price increased from $520,000 to $522,000
244 homes were for sale
A total of 118 homes sold
Days on market: 85
3. The plateau: Sammamish, Issaquah, North Bend, and Fall City
The odds of selling a home were 44%
Median sales price increased from $467,000 to $472,000
There were 467 homes for sale
A total of 203 homes sold
Days on the market: 110
4. Woodinville/Bothell/Kenmore/Duvall/North Kirkland
The odds of selling a home were 42%
Median sales price increased from $383,000 to $385,000
397 homes were for sale
A total of 165 homes sold
Days on Market: 103
5. Kirkland
The odds of selling a home were 36%
Median sales price decreased from $550,000 to $430,000
132 homes were for sale
A total of 47 homes sold
Days on Market: 72
6. West Bellevue
The odds of selling a home were 34%.
Median sales price increased from $973,000 to $1,185,000
118 homes were for sale
A total of 40 homes sold
Days on Market: 107
7. Redmond/Education Hill/ Carnation
The odds of selling a home were 32%
Median sales price increased from $452,000 to $538,000!
219 homes were for sale
A total of 69 homes sold
Days on Market: 159
If you’d like more specific information about your neighborhood or home, feel free to contact either Brooks or me.
*(The odds of selling a home in each area is a result of the number of homes for sale divided by the actual number of home sales, so if 10 out of 100 homes sold, the odds of selling would be 10/100 or 10%)
** (y-o-y) median pricing is comparing year over year numbers.
 Facebook
 Twitter
 Pinterest
 Copy Link
