
 Facebook
 X
X
 Pinterest
 Copy Link
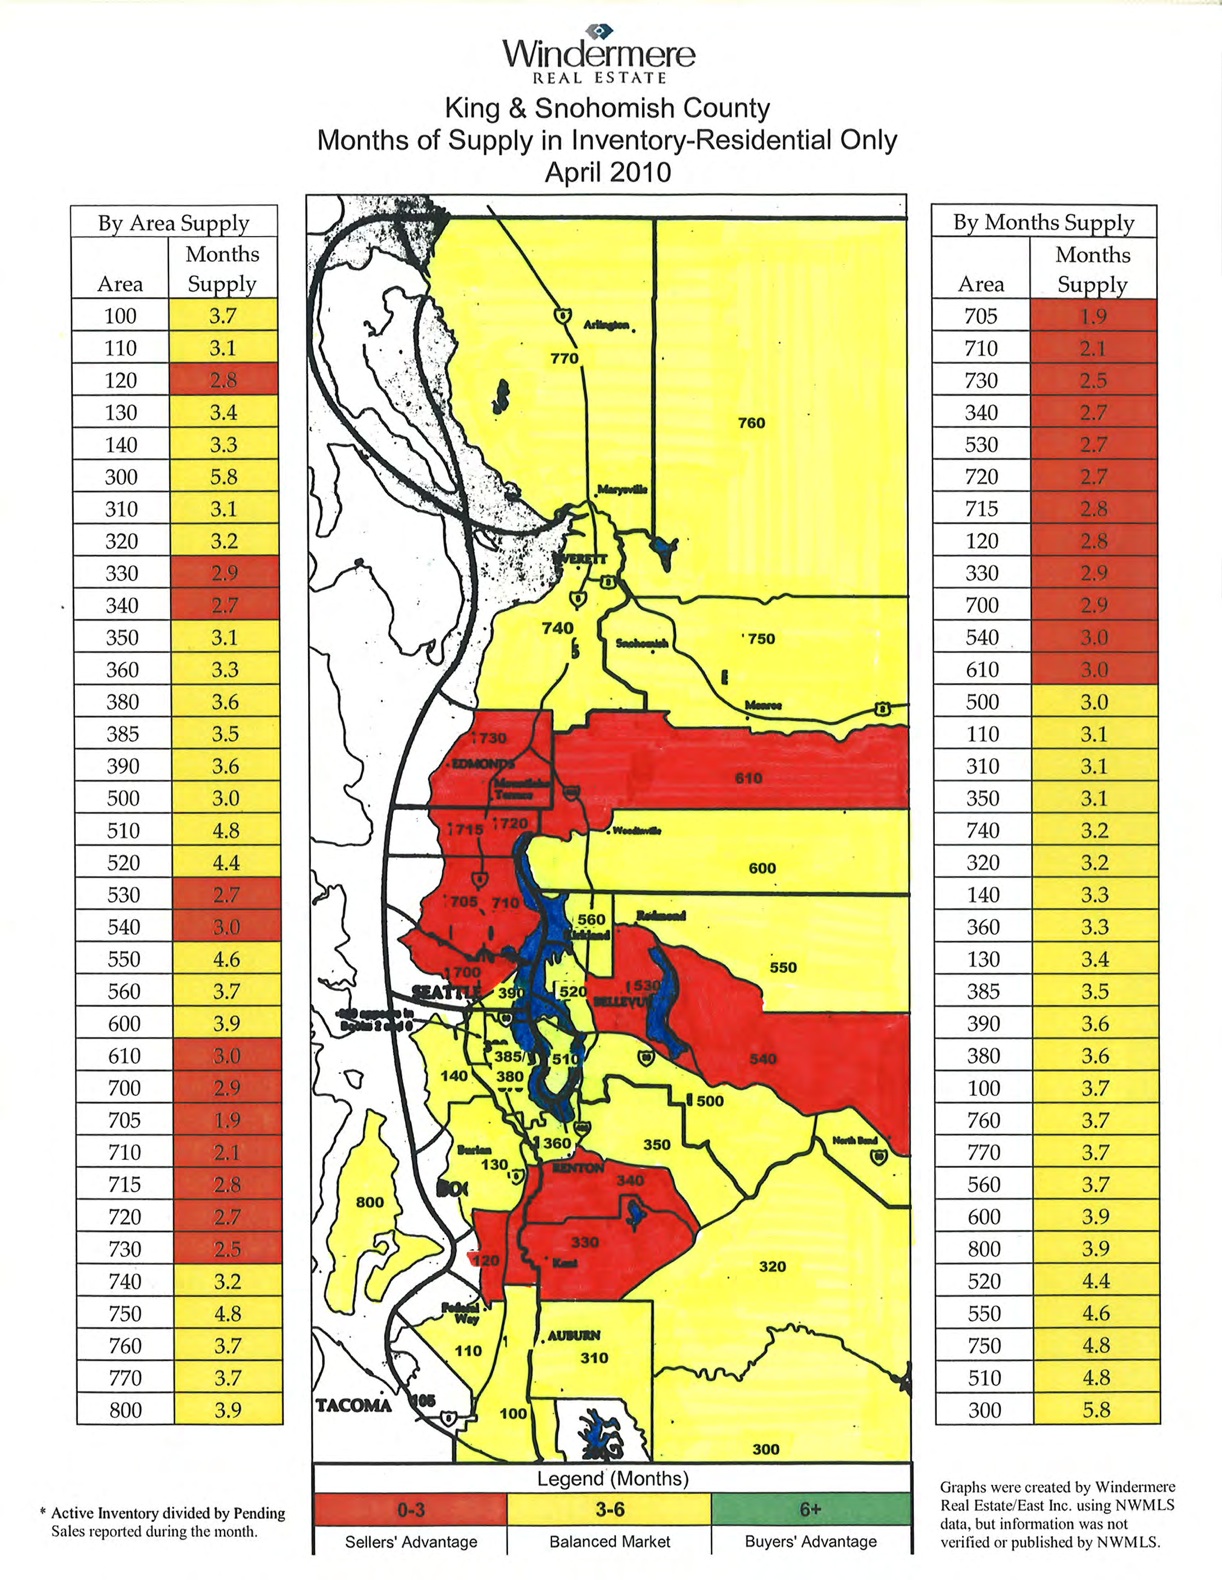
King Snohomish Counties Real Estate Market 4-30-10
What do the numbers on the map mean?
The map is divided into the numbered areas as defined by our Northwest Multiple Listing Service (NWMLS). Downtown Bellevue is area 520 and East Bellevue is area 530, as an example.
What do the colors mean?
Red means it’s a sellers’ market, a sellers’ advantage.
Yellow means a balanced market between buyers and sellers.
Green means it’s a buyers’ market.
If you take each area as shown on the map and look to the area number on the side of the map, it will tell you how long it would take to sell every home currently for sale if no other home came up on the market in that area.
The first time in years, literally, that there were no buyers’ markets on the King-Snohomish County, Washington map of real estate. Last month, there was one area, Vashon Island, which is now coming up as a balanced market.
The two hottest selling markets on the eastside in April, 2010?
The first is Redmond, near Microsoft, East Bellevue and the second is the plateau area which includes Sammamish, parts of Issaquah, North Bend, and Fall City.
