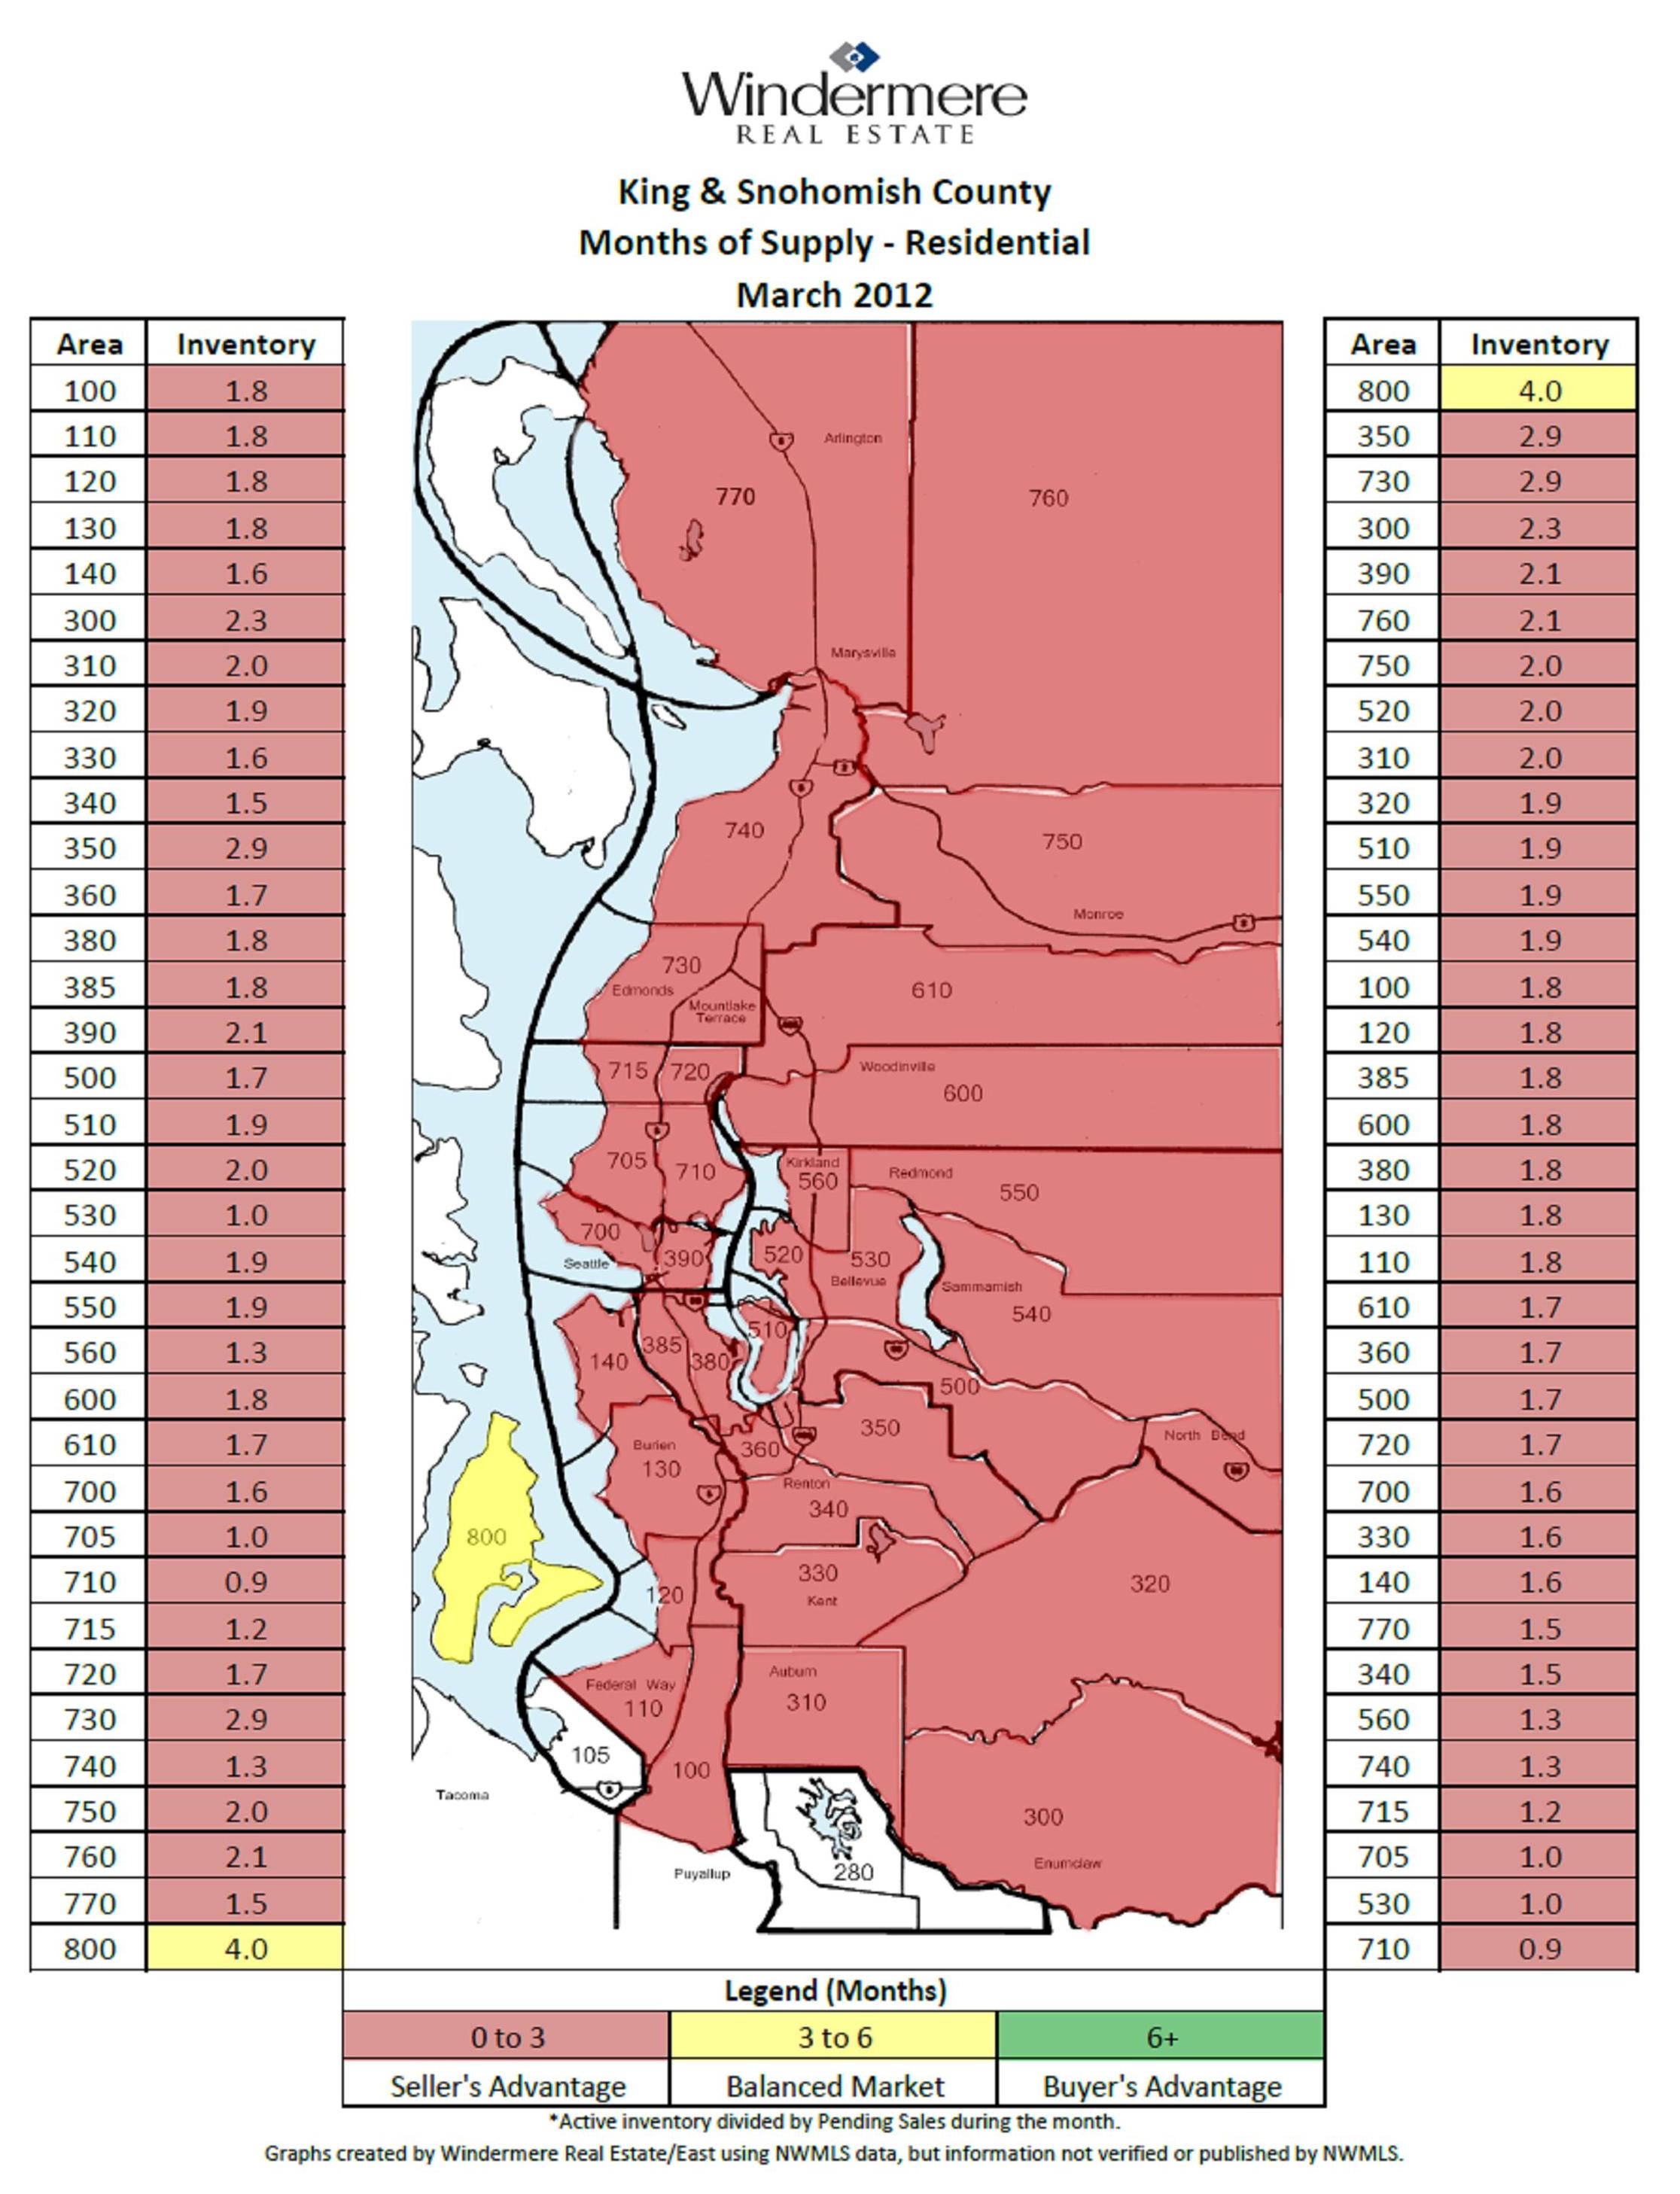
Red is busting out all over the map of Seattle Real Estate Sales! Red means it’s a sellers market in which homes, on average, are selling in less than 3 months! The numbers are really strong in all of the eastside cities, but top sales go to the 80% sales rate in Redmond and East Bellevue near Microsoft last month! Incredible odds! In every other area on the eastside over 40% of the homes sold.
Closed sales, the sales in which the new buyer now owns the house, are showing lower sales numbers because the homes that closed in March actually got offers in January or February. Expect the number of sales for each of the coming months to jump higher because March home sales will be closing in April and May.. Market time will continue to decrease as this faster sales market continues.
Pricing has still been dropping as you can see below, but should become more stable as the prices from these March sales becomes public. Some areas actually showed an increase in pricing, but remember, it is a representation of the sales that sold in March only.
Multiple offers, a shortage of homes, a huge percentage of homes selling in a short amount of time are all the buzz words for the Seattle eastside real estate market.
The cities below are reported together to follow our MLS areas (multiple listing service) information.
1. Redmond/East Bellevue
The odds of selling a home were 80%
Median sales price decreased from $476,000 to $427,000 (y-o-y)**
95 homes were for sale
A total of 76 homes sold
Days on the market: 135
2. Kirkland
The odds of selling a home were 57%
Median sales price decreased from $570,000 to $469,000
137 homes were for sale
A total of 53 homes sold
Days on Market: 83
3. West Bellevue
The odds of selling a home were 46%.
Median sales price increased from $888,000 to $1,000,000
117 homes were for sale
A total of 54 homes sold
Days on Market: 70
4. The plateau: Sammamish, Issaquah, North Bend, and Fall City
The odds of selling a home were 44%
Median sales price decreased from $505,000 to $462,000
There were 436 homes for sale
A total of 193 homes sold
Days on the market: 127
4. (tie) South Bellevue/Issaquah
The odds of selling a home were 44%
Median price increased from $510,000 to $560,000
225 homes were for sale
A total of 98 homes sold
Days on market: 99
5. Redmond/Education Hill/ Carnation
The odds of selling a home were 43%
Median sales price increased from $411,000 to $472,000
193 homes were for sale
A total of 83 homes sold
Days on Market: 100
6. Woodinville/Bothell/Kenmore/Duvall/North Kirkland
The odds of selling a home were 42%
Median sales price decreased from $423,000 to $369,000
365 homes were for sale
A total of 151 homes sold
Days on Market: 100
If you’d like more specific information about your neighborhood or home, feel free to contact either Brooks or me.
*(The odds of selling a home in each area is a result of the number of homes for sale divided by the actual number of home sales, so if 10 out of 100 homes sold, the odds of selling would be 10/100 or 10%)
** (y-o-y) median pricing is comparing year over year numbers.
 Facebook
 X
X
 Pinterest
 Copy Link
