Seattle Eastside Real Estate from 2009-2013
Looking for a terrific picture of the state of real estate on Seattle's Eastside? Here it is! Since we're at the beginning of a new year, it's good to see where we've been over the last 5 years. It gives a good indication of where we're headed for 2014.
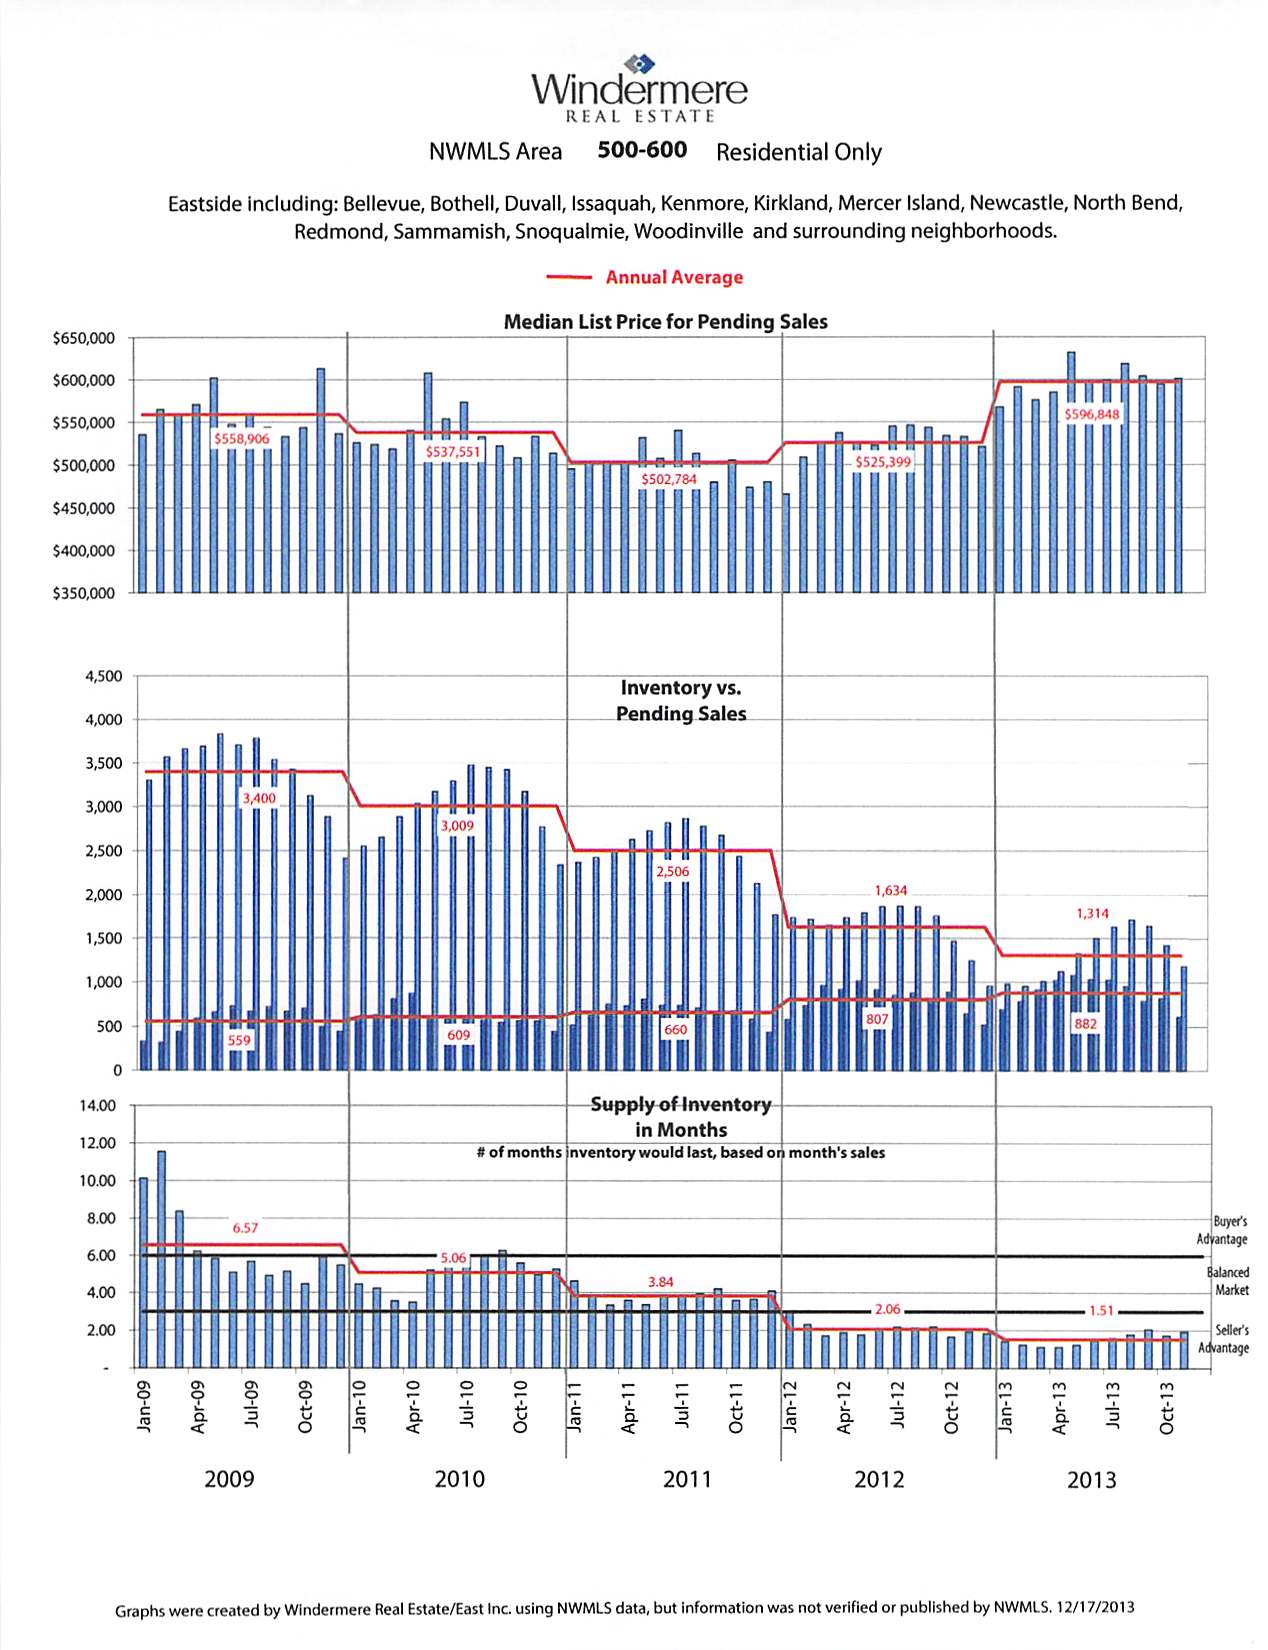
The above chart highlights the most important trends in real estate over the last 5 years, from 2009-2013. You can find median pricing, the number of homes on the market and the number of home sales per month and by year, and how long the supply would last, based on the number of home sales per month.
Here's how each of the three sections of the chart are set up. Each portion is divided by the years 2009-2013, as you can see along the bottom of the chart. The blue bars show a different month in each of these years. The red line shows the average for the year.
The top portion of the chart has the information everyone seems to want to know first, the median pricing. The fabulous news is how much higher median pricing is now than just a few years ago. On the eastside, the average median price for a home sale was just under $600,000 at $596,848.
The second chart demonstrates why prices have increased so dramatically. It's the law of supply and demand. The supply dropped considerably in 2012 and and 2013, thus increasing demand for this drastically decreased inventory of homes for sale, causing prices to jump. With the amount of inventory at a low point at the start of 2014, we expect listings to move very quickly. Our first listing of the year sold in 24 hours. The home was not underpriced. It was well priced, staged beautifully, and in excellent condition. This type of home is very "hot" right now, as buyers are looking to find great homes.
Another interesting detail to notice on the middle portion of the chart besides the decline in supply, is the number of home sales each year stays more constant, even as the supply changes. The number of sales did increase in the last two years, but not nearly as dramatically as the decline in supply, The increase in sales is a reflection of more buyers feeling comfortable making home purchases.
The lower section shows how much of a supply of homes there is available each month. In 2009, when there were, on average 3400 homes for sale, it would have taken over 6 months to sell all the homes. In 2013, when the Seattle Eastside real estate had so few homes for sale, it would have taken 1 1/2 months to sell all the available homes.
The take away from all of this is how terrific we find the real estate market to be at the end of 2013, which is the start of 2014 market. We have low inventory plus many buyers equaling a high demand for homes, short market times, and increasing prices. If you plan to make a move in 2014, consider doing so early in the year, when the inventory is at a low point. Homes sell in every month on the eastside as you can see from this chart, the competition is far less when there are fewer homes for sale.
If you'd like more specific information regarding your home and/or you're thinking about making a move, feel free to contact us. All the best in 2014!
 Facebook
 X
X
 Pinterest
 Copy Link