
 Facebook
 X
X
 Pinterest
 Copy Link

Home Sales Activity for King and Snohomish Counties, May, 2010
During May “green” crept back into a number of Seattle areas. One large area on the eastside, Woodinville, Bothell, Kenmore, Duvall, and north Kirkland was “green,” back as a buyer’s market.
April was the first month in a very long time in which there was no ” green,” no buyers’ markets in almost all the Seattle-eastside areas. In April, the Seattle area real estate market was the strongest in years. This is most likely a direct result of the 2010 tax credit. Both buyers and sellers were rushing to buy and sell before the expiration of the credit.
May represented a lull in the Seattle real estate market. Was this a temporary lull or our new normal? The next several months will be good indicators, although summer tends to be a slower time every year in Seattle real estate. Home buyers and sellers are like everyone else. Seattleites play outside in summer. Of course, that’s providing the sun ever comes out this year!
The good real estate news is there are still great homes and condos out there to buy and interest rates are at historic lows. The loss of the tax credit may not make much of a difference when calculating the savings in monthly payments over time.

Interest Rates 6-2010
It may be the fall before we can determine the true pace of Seattle real estate. I’ll keep you posted.

- King Snohomish Counties Real Estate Market 4-30-10
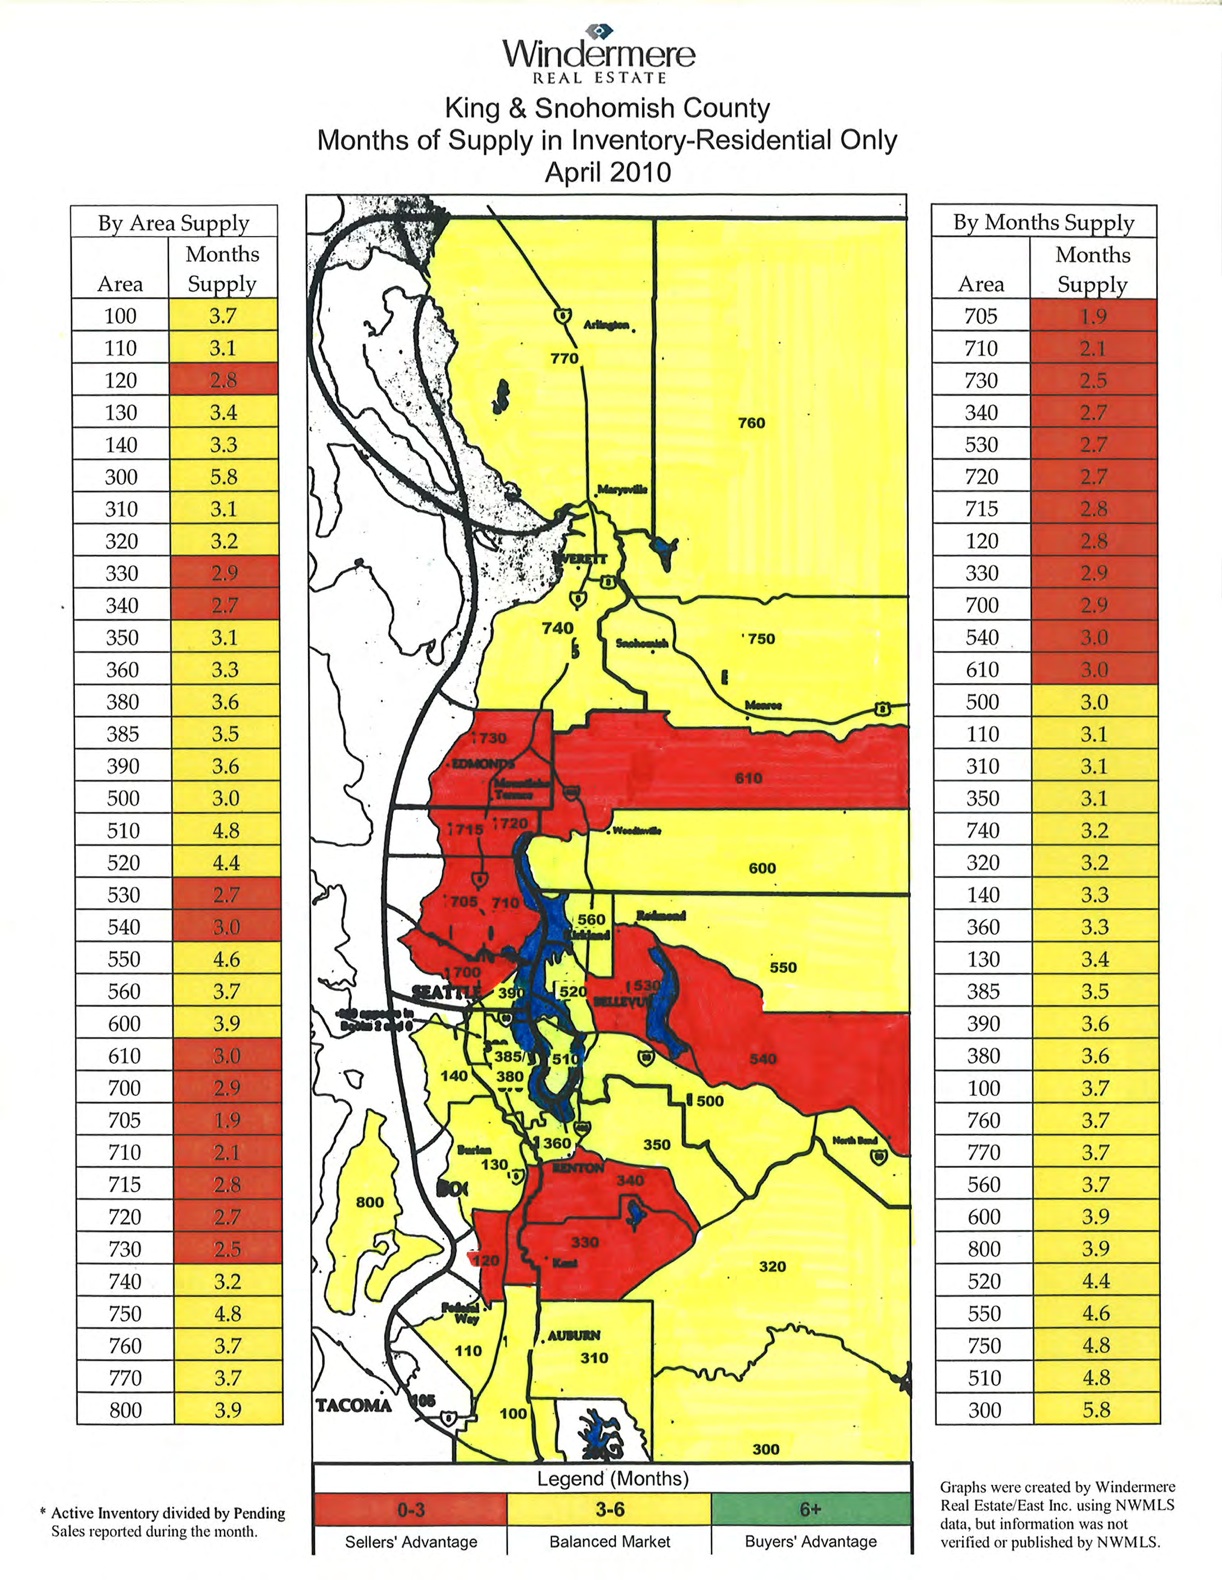
What do the numbers on the map mean?
The map is divided into the numbered areas as defined by our Northwest Multiple Listing Service (NWMLS). Downtown Bellevue is area 520 and East Bellevue is area 530, as an example.
What do the colors mean?
Red means it’s a sellers’ market, a sellers’ advantage.
Yellow means a balanced market between buyers and sellers.
Green means it’s a buyers’ market.
If you take each area as shown on the map and look to the area number on the side of the map, it will tell you how long it would take to sell every home currently for sale if no other home came up on the market in that area.
