
 Facebook
 X
X
 Pinterest
 Copy Link
May Was a Strong Real Estate Market on Seattle’s Eastside

With a 46% chance of getting a home sold in May, home sellers in Bellevue, Kirkland, Redmond and other eastside cities had great odds of getting their home sold. We saw a slight uptick in the number of homes for sale, but that did not change the fast paced nature of the market. When almost half of the homes for sale are selling, a few more listings doesn't make that much difference.
But if many more listing come on the market will that change the balance of the market between buyers and sellers? Time will tell, but historically when the demand outstrips the supply, we have a fast paced sellers market. If the supply increases, the competition between listings could heat up and we could have a good market, but not as fast paced. The market would be more balanced between buyers and sellers. The market balance in the upcoming months will hinge on the supply of available homes and the number of buyers.
The market is great, but 54% of the homes did not sell. One of the necessary elements necessary for a quick, well priced sale was more than likely missing for many of these homes. The homes that did not sell may have needed to be better priced or have sharper photos, smart staging and/or marketing. These homes may not have gotten the attention from the savvy buyers if one of the key elements for a successful sale was missing. They focused on those homes that are well priced and show well.
How did this past May compare to May of 2011?
- 46% of the available homes sold this past May, 24% sold in May, 2012.
- Homes sold in 58 days, which is down from 76 days in May, 2012.
- Median pricing remained the same at $500,000. This is very good news!
- Homes sold within 96% of the original asking price. Last year homes sold within 92% of the asking price.
- 23% more homes sold this year.
The market stats over the next few months will dictate whether Seattle-eastside real estate will remain a hot seller's market.
Will the number of listings increase?
Will the number of buyers decrease?
Will prices continue to increase slightly?
Stayed tuned to to see how our eastside real estate market turns out! Check in with us next month.
If you'd like more information specific to your home, don't hesitate to contact us.
April Showers Brought Lots of Real Estate Sales to Seattle’s Eastside

Seattle Eastside Real Estate Sales Through April, 2012
The Seattle eastside real estate market is still hot! Real estate sales’ numbers on Seattle’s Eastside are terrific. April sales numbers were similar to March when 46% of the available homes sold. In April, because there were about 100 more homes for sale, the odds of selling dropped slightly to 42% sold. Home sellers in Bellevue, Kirkland, Redmond and other eastside cities have the best odds of selling a home since 2007! Much of this is due to the positive economy here in the Seattle area.
New listings are coming on the market and selling quickly. If no other homes were to come on the market, it would only take 1.4 months to sell all of the eastside homes. Demand is high, helping the good homes that are well priced, show well, have fabulous photos, and great marketing to fall into the 42% of homes that sold last month. Some homes have sold for over full price with multiple offers.
Remember, 58% of the homes did not sell and, more than likely, are missing one of the necessary elements necessary for a quick, well priced sale. The homes may need to have a better price tag or photos, staging or marketing. It’s still competitive and buyers are savvy enough to identify those homes that are well priced. Even though there aren’t a lot of homes for sale, there’s enough new listings coming on the market each month to guarantee a fresh supply of available homes. With interest rates remaining low, some buyers still take time to make a buying decision.
We sold several homes last month in a matter of days, with multiple offers and for over full price. We worked with all of the sellers for a while before their homes actually came on the market. One seller contacted us last summer so she would have the time to do everything needed to get ready to sell without creating additional stress. Most of our sellers contact us a few months before going on the market. It gives us enough time to get contractors in, if needed, to paint, re-carpet or refresh the landscaping.
How did this past April compare to April of 2011? Truly, there’s not much of a comparison between this year and last, but here it is:
- 42% of the available homes sold this past April, 23% sold in April, 2011.
- Homes sold in 101 days, which is down from 105 days in April, 2011.
- Median pricing was down to $485,000 from $492,000.
- Homes sold within 94% of the original asking price. Last year homes sold within 91% of the asking price.
- 23% more homes sold this year.
So if you plan to land in the 42% of homes that sell, not the 58% that did not, start the process by contacting your Realtor well ahead of time.
A Stampede for Homes in Bellevue, Kirkland and other Eastside Cities in March
-

The chart tells it all! Look at the huge, and I mean huge, jump in sales over the past few months, a 56% increase in sales since January. Forty-six percent of the available homes sold in March. There’s a big stampede out there for homes in Bellevue, Kirkland, Redmond and other eastside cities. This stampede means there’s often more than one buyer for a home, causing multiple offer situations.
We’re starting to see a pattern with eastside real estate. Lots of homes are selling and homes are selling quickly because there’s such a huge demand. Almost 900 homes were added to the market in March, but with 771 sales, the number of homes for sale has stayed almost the same. There was a small drop of 52 homes for sale from February to March.
How did this past March compare to March of 2011?
- 46% of the available homes sold this past March. 23% sold in March, 2011.
- Homes sold in 109 days, which is down from 137 days in March, 2011.
- Median pricing was down to $470,000 from $500,000.
- Homes sold within 93% of the original asking price. Last year homes sold within 91% of the asking price.
- 24% more homes sold this year.
I expect to see this real estate data change as this fast paced market continues. Expect to see median home prices stay more level, market time to decline, and homes selling closer to the asking prices.
- The Seattle eastside market is not following the usual trends we see this time of year. Usually market trends follow more of what the chart shows for last year. The number of homes for sale usually increases each month until in peaks sometime in the summer. As the year comes to an end, the number of homes for sale usually drops. We’re not seeing this at all this year. This year, we see fewer homes for sale each month. The big news, though, is still in the number of homes that sell each month.
Not all homes sell in a heartbeat. You can’t just put a sign in the front yard and expect everyone to line up.
The homes that are positioned properly in terms of price and condition relative to the competition are the homes that sell quickly. Your home has to show well and be priced competitively in order to grab the attention of the buyers. - 46% of the available homes sold this past March. 23% sold in March, 2011.

There Are Some "Hot" Real Estate Markets Around Seattle
There are some hot real estate markets in the Seattle area. These “red” hot areas are shown below. The usual suspects of Queen Anne and Capital Hill experienced a hot market in February. The newest suspect, East Bellevue and Redmond near Microsoft, my neck of the Seattle real estate market, was also going strong. In that area, 35% of the available homes sold last month, the best odds on the eastside. It’s exciting to see, since it’s been years since we’ve had “red” or a seller’s market on the eastside.*
I keep hearing about homes selling quickly and with multiple offers in a variety of price ranges. Since most of the eastside is a balanced real estate market,** this only happens for the best homes. It happens for the “red” hot homes with hot prices and in beautiful condition. There are number of other homes that take a while to sell, often with price reductions before getting the offer.
Hotter King & Snohomish County real estate markets 2-28-11

———————————
What do the colors mean?
*Red means it’s a sellers’ market, a sellers’ advantage. Homes take less than 3 months to sell.
**Yellow means a balanced market between buyers and sellers. Homes on the average take 3-6 months to sell.
Green means it’s a buyers’ market. Homes take longer than 6 months to sell.
If you take each area as shown on the map and look to the area number on the side of the map, it will tell you how long it would take to sell every home currently for sale if no other home came up on the market in that area.
What do the 3 digit numbers on the map mean?
The map is divided into the numbered areas as defined by our Northwest Multiple Listing Service (NWMLS). Downtown Bellevue is area 520 and East Bellevue is area 530, as an example.
Can you see from the map how the real estate was doing in your city did last month? If you’d like more specific information for your neighborhood, please feel free to contact me.
Is This The New "Normal" for Seattle Area Real Estate?
Maybe this is how real estate is going to be in the Seattle area. Maybe we’ll have some local markets where things are “hot” just for the buyer, and, someday again, even for the seller. But maybe the Seattle marketplace will be more balanced (yellow on the map below) between the buyers and the sellers. Maybe this is the new “normal” real estate market. The majority of homes will sell in 3-6 months, some will sell for full price, some homes will sell with a small price reduction, and some will even have multiple offers. Still others will undergo a number of price reductions before selling and some will not even get an offer.
Here’s what I wrote in my November post on the real estate market. I shared similar thoughts then, so I’m wondering if we’re starting to see a pattern here.
Does this mean it’s no longer a challenge to sell a home? Absolutely not. The competition is still very stiff. There are a lot of homes for buyers to buy. A market in which it takes homes 3-6 months to sell is still a challenging, but not a terrible, real estate market. In a balanced market, some homes sell quickly for a good price, others take a lot longer to sell with a steep discount in the the asking price, and still others don’t sell at all. I’m still going to be telling home sellers to have the best home out there and expect a sale to take a long time to happen. Homes that sell have to be a really good value to be the ones that sell. Believe it or not, this is pretty typical of a more balanced, realistic market. A realistic market is not a fast paced real estate market. A realistic market will have some distressed home sellers. Although this is a cause of major concern and I am not minimizing the situation for those who are distressed sellers, the majority of eastside homes are NOT distressed sales.
So maybe this is the new “normal”? What do you think?

The State Of Seattle Area Real Estate in December, 2010

- Seattle Area Real Estate 11-30-10
———————————
What do the 3 digit numbers on the map mean?
The map is divided into the numbered areas as defined by our Northwest Multiple Listing Service (NWMLS). Downtown Bellevue is area 520 and East Bellevue is area 530, as an example.
What do the colors mean?
Red means it’s a sellers’ market, a sellers’ advantage. Homes take less than 3 months to sell.
Yellow means a balanced market between buyers and sellers. Homes on the average take 3-6 months to sell.
Green means it’s a buyers’ market. Homes take longer than 6 months to sell.
If you take each area as shown on the map and look to the area number on the side of the map, it will tell you how long it would take to sell every home currently for sale if no other home came up on the market in that area.
This Past Month Seattle Eastside Real Estate Was Balanced Between Buyers and Sellers

Seattle Area Real Estate 11-30-10
The Seattle-eastside market is balanced. Surprised by that? Here’s why I say this: A balanced market is when homes on average are selling in 3-6 months. This means there was a more level playing field between buyers and sellers during that particular month, in this case November 2010. Given the news we hear, it’s surprising to think of the eastside real estate market in this way.
Does this mean it’s no longer a challenge to sell a home? Absolutely not. The competition is still very stiff. There are a lot of homes for buyers to buy. A market in which it takes homes 3-6 months to sell is still a challenging, but not a terrible, real estate market. In a balanced market, some homes sell quickly for a good price, others take a lot longer to sell with a steep discount in the the asking price, and still others don’t sell at all. I’m still going to be telling home sellers to have the best home out there and expect a sale to take a long time to happen. Homes that sell have to be a really good value to be the ones that sell. Believe it or not, this is pretty typical of a more balanced, realistic market. A realistic market is not a fast paced real estate market. A realistic market will have some distressed home sellers. Although this is a cause of major concern and I am not minimizing the situation for those who are distressed sellers, the majority of eastside homes are NOT distressed sales.
———————————
What do the 3 digit numbers on the map mean?
The map is divided into the numbered areas as defined by our Northwest Multiple Listing Service (NWMLS). Downtown Bellevue is area 520 and East Bellevue is area 530, as an example.
What do the colors mean?
Red means it’s a sellers’ market, a sellers’ advantage. Homes take less than 3 months to sell.
Yellow means a balanced market between buyers and sellers. Homes on the average take 3-6 months to sell.
Green means it’s a buyers’ market. Homes take longer than 6 months to sell.
If you take each area as shown on the map and look to the area number on the side of the map, it will tell you how long it would take to sell every home currently for sale if no other home came up on the market in that area.
There's No Sign of a Seller's Market in Seattle Real Estate

Seattle Area Real Estate Map Showing Different Market Performance 10-31-10
The lack of “red” showing a seller’s market in Seattle area real estate is no big surprise. However, it’s good to see the market was more balanced in some Seattle area neighborhoods in October.
A balanced market is when homes on average are selling between 3-6 months, which means there was a level playing field between buyers and sellers in those areas for that particular month. A buyer’s market means the homes on average are taking longer than 6 months to sell and a seller’s market means the homes take less than 3 months to sell.
A real estate market is labeled a buyer or seller’s market depending on how long it took the homes to sell that month. Since the sales can vary each month, the type of real estate market can very easily change, going back and forth between a buyer or seller advantage.
Even though it’s more challenging for sellers, there are homes that stand out and sell with multiple offers or for full price. Look at the overall real estate market, look at the market in the neighborhood, and then look at the specific home and how well it’s priced for that market. When making a pricing decision, all of this data is important.
———————————
What do the numbers on the map mean?
The map is divided into the numbered areas as defined by our Northwest Multiple Listing Service (NWMLS). Downtown Bellevue is area 520 and East Bellevue is area 530, as an example.
What do the colors mean?
Red means it’s a sellers’ market, a sellers’ advantage. Homes take less than 3 months to sell.
Yellow means a balanced market between buyers and sellers. Homes on the average take 3-6 months to sell.
Green means it’s a buyers’ market. Homes take longer than 6 months to sell.
If you take each area as shown on the map and look to the area number on the side of the map, it will tell you how long it would take to sell every home currently for sale if no other home came up on the market in that area.
It Was Mostly a Buyers' Market on Seattle's Eastside in September, 2010

King & Snohomish County Reat Estate, 9-30-10
Sellers’ markets on this map are in red and there is no red in Seattle or on Seattle’s eastside. Most of the neighborhoods are buyers’ markets, which are in green. Only two areas, Bellevue and Redmond near Microsoft, which is area 530, and area 600, which is Woodinville, Bothell, Duvall, are balanced markets. Last month, Bellevue and Redmond near Microsoft and Kirkland were the balanced markets.
A balanced market is when homes on average are selling between 3-6 months, which means there was a level playing field between buyers and sellers in those areas for that particular month. A buyers’ market means the homes on average are taking longer than 6 months to sell and a sellers’ market means the homes take less than 3 months to sell.
A real estate market is labeled a buyer or sellers’ market depending on the homes that actually sold that particular month. Since the sales can vary each month, the type of real estate market can very easily change, going back and forth between a buyer or seller advantage. Don’t count on the market staying the same each month in any area.
Remember, too, an area may be a buyers’ market and there can still be a terrific home that’s the best of the competition and sells with multiple offers or for full price. It’s always important to understand how much competition a particular home has and how well priced it is when compared to the competition. So look at the overall real estate market, look at the market in your neighborhood, and then look at the specific home and how well it’s priced for that market. Weigh all of this information when making a buying decision or a decision as to how to price your home.
What do the numbers on the map mean?
The map is divided into the numbered areas as defined by our Northwest Multiple Listing Service (NWMLS). Downtown Bellevue is area 520 and East Bellevue is area 530, as an example.
What do the colors mean?
Red means it’s a sellers’ market, a sellers’ advantage.
Yellow means a balanced market between buyers and sellers.
Green means it’s a buyers’ market.
If you take each area as shown on the map and look to the area number on the side of the map, it will tell you how long it would take to sell every home currently for sale if no other home came up on the market in that area.
Seattle-Eastside Real Estate is Mostly Green, A Buyers' Market

- King & Snohomish County Real Estate Activity 8-31-10
The Seattle-eastside has flipped back almost completely to a buyers’ market. Two areas, Redmond and East Bellevue near Microsoft and Kirkland, were more balanced real estate markets, with the market time to sell a home falling between 3 to 6 months. If you check out what the colors represent below, you can see how much of King County real estate is in the buyers’ camp right now. With today’s low interest rates and the ability to negotiate strongly because of this market trend, it’s probably a better time to buy a home now than when everyone was rushing to beat the expiration of the tax credit. The savings would be spread out over a longer time period, but would be worth far more than the one time $8000 tax credit. If you do decide to buy, remember to look for a home you can grow in that’s close to transportation, shopping, schools, and jobs. A home that meets these criteria will hold its value better.
What do the numbers on the map mean?
The map is divided into the numbered areas as defined by our Northwest Multiple Listing Service (NWMLS). Downtown Bellevue is area 520 and East Bellevue is area 530, as an example.
What do the colors mean?
Red means it’s a sellers’ market, a sellers’ advantage.
Yellow means a balanced market between buyers and sellers.
Green means it’s a buyers’ market.
If you take each area as shown on the map and look to the area number on the side of the map, it will tell you how long it would take to sell every home currently for sale if no other home came up on the market in that area.
There Were No Sellers Markets in the Seattle Area in July, 2010

King & Snohomish County Real Estate, 7-31-10
There were no sellers’ market in July. “Red” indicates a sellers’ market with homes selling in less than 3 months. If you look at the map above, all the Seattle markets are either a buyer’s market or a balanced market between buyers and sellers.
There’s a mix on Seattle’s eastside. Some markets are buyers’ markets such as West Bellevue and the Sammamish plateau cities of Sammamish, North Bend, Preston, and Fall City. Homes in these real estate markets took on average over 6 months to sell. The majority of Seattle Eastside real estate was a balanced market with homes selling between 3-6 months.
The state of the real estate market is a huge contrast from just three months ago when there was no “green” on the map at all.

- King Snohomish Counties Real Estate Market 4-30-10
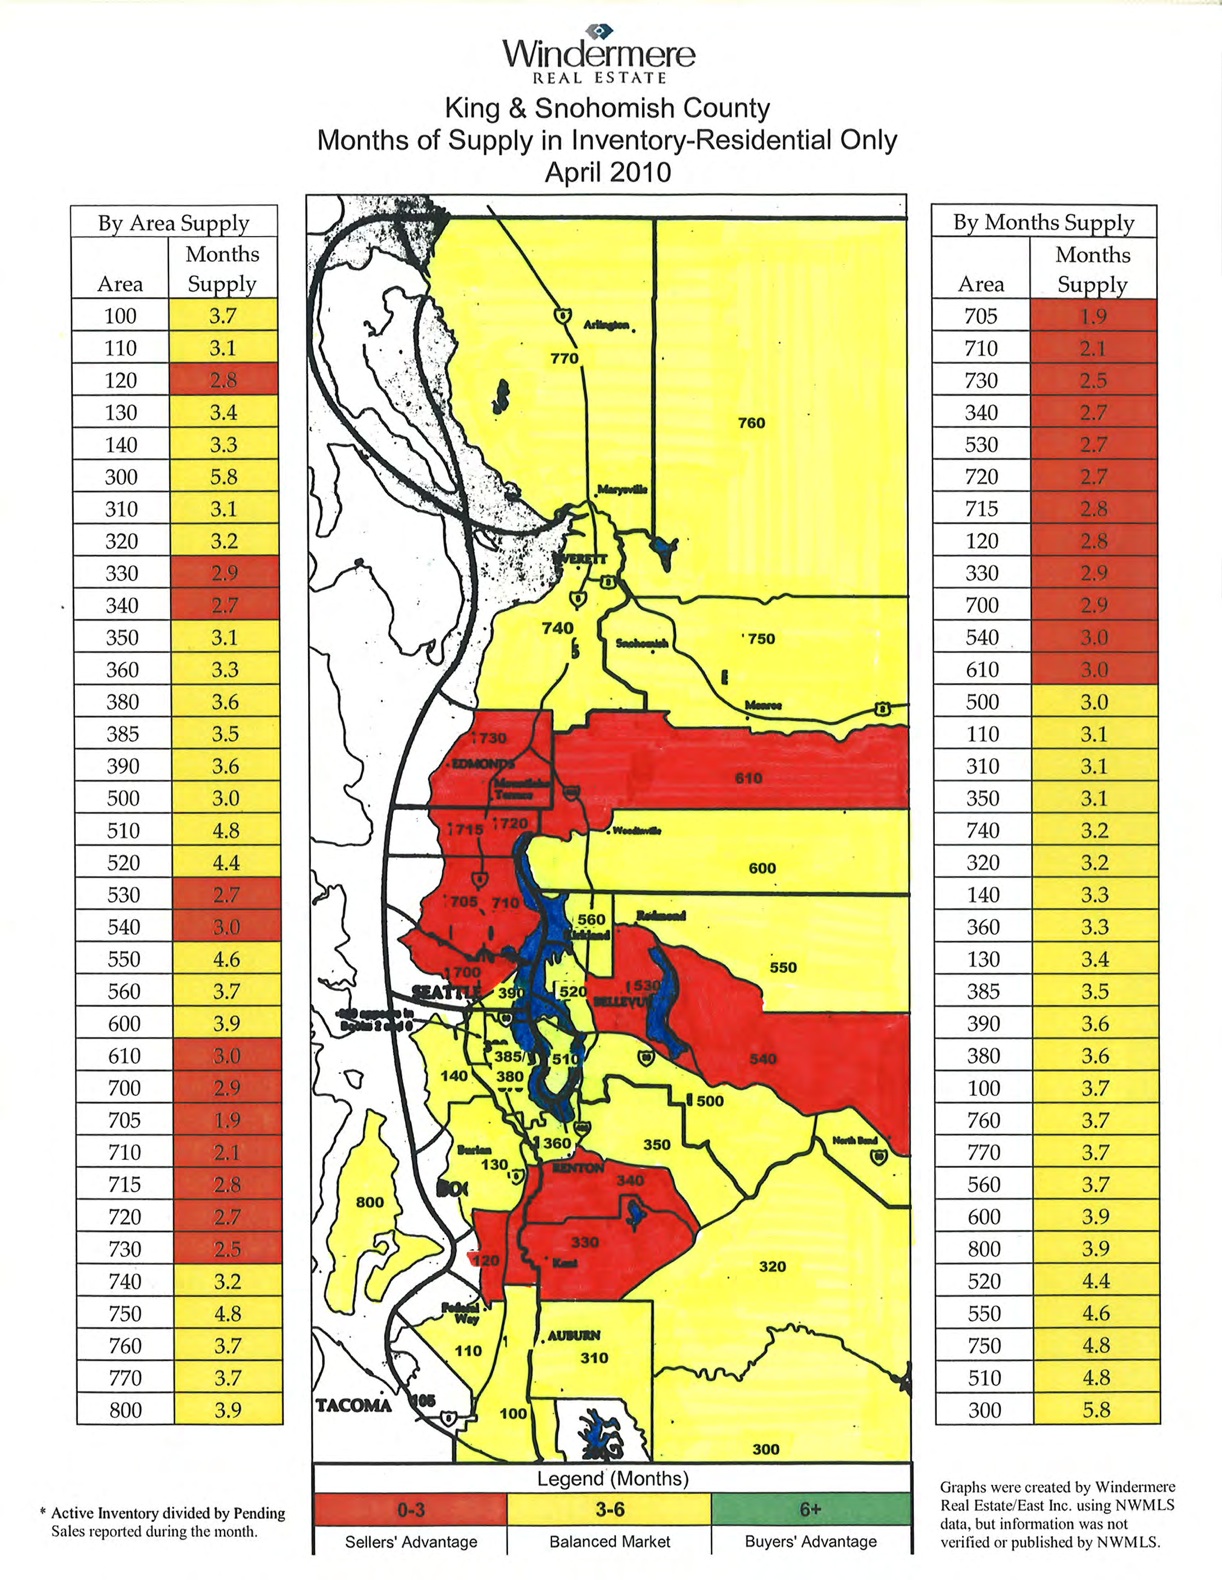
Clearly, the tax credit did its magic during that time. Is it the economy, job situation or is it the lack of urgency with interest rates slated to be low for a long time that is keeping buyers from making a home purchase? I’ve heard opinions about all three reasons as the cause for the slow moving real estate market. What do you think?
__________________________________________________________________________________
What do the numbers on the map mean?
The map is divided into the numbered areas as defined by our Northwest Multiple Listing Service (NWMLS). Downtown Bellevue is area 520 and East Bellevue is area 530, as an example.
What do the colors mean?
Red means it’s a sellers’ market, a sellers’ advantage.
Yellow means a balanced market between buyers and sellers.
Green means it’s a buyers’ market.
If you take each area as shown on the map and look to the area number on the side of the map, it will tell you how long it would take to sell every home currently for sale if no other home came up on the market in that area.
