
 Facebook
 X
X
 Pinterest
 Copy Link
How Badly is Seattle's Eastside Real Estate Affected by Distressed Sales
“Distressed Homes Sales Dragging Prices Down” screamed the print version of The Seattle Times, while the online version shouted “Median Home Price in King County Drops in February, Dragged Down by Bank Repos.
Pretty scary headlines. Scary headlines certainly attract readers. Distressed home sales, bank repos and short sales, are out there and affecting home values, but in varying degrees depending on which neighborhood is being discussed. If you read further down in the article:
The percentage of King County single-family homes that fit the “distressed” category in February varied widely by area, according to Windermere’s analysis.
By lumping all of King County together, it gives an inaccurate picture of Seattle real estate. Seattle real estate is far more localized. The neighborhoods of Queen Anne and Capitol Hill are usually the strongest performing areas, while the eastside suburbs of Bellevue, Redmond, Kirkland, and others are doing better than most of King County. The suburbs of Mercer Island and Medina have few distressed properties for sale.
The chart below gives a picture of the 2010 distressed property sales for all the counties around Seattle. My focus is on Seattle’s eastside neighborhoods, since it’s the market where I work. The eastside data is broken out from the rest of King County, because it’s usually different than the rest of the county. The pattern for distressed sales activity can be seen through 2010. The eastside had less distressed properties for sale than the rest of King County. I expect a similar pattern to continue in 2011, although the numbers may be different. When the 1st quarter numbers are released, I’ll report those numbers.
Irrespective of the distressed sales issue, homes are selling well in some areas. Prices are less than they were, but there are fewer homes for sale in many neighborhoods. So the old law of supply and demand is working in these neighborhoods. Near Microsoft in Redmond, there were three home sales that closed this past week. All the homes sold in less than 8 days. One was for full price, another for slightly over, and one sold for about 2% less than the asking price. Neighborhoods in Kirkland have a lot less homes for sale than is typical.
Distressed home sales are a part of the picture of Seattle eastside real estate, but they are not the complete picture. Too bad the screaming headlines didn’t balance more of the good news with the bad.

2010 Distressed Properties by Seattle Area Counties
What is happening in your neighborhood? Are homes selling? Are there a lot of distressed sales?
Seattle Economist's Predictions for the 2011 Real Estate Market, Part II
Matthew Gardner, of Gardner Economics, spoke at our annual Windermere Real Estate/East, Inc kick-off meeting today. Mr. Gardner shared his thoughts about the local economy and Seattle real estate. Here are some of the highlights:
- Seattle will recover more quickly than other parts of the west.
- Growth will be slow and from the center, Seattle, out to the suburbs.
- The private sector has increased job growth in the last 4-5 months and will continue to do so.

Private Sector Employment in the Seattle Area
- There will be more price corrections for those hi-rise condos that have not sold both in Seattle and Bellevue.
- Buyers are still looking for good deals and feel uncertainty remains.
- Prices are stable and, hopefully, will stay that way this year.
- Banks are not releasing all of the bank owned homes to sell. The banks would go bankrupt if they flooded the market with these homes, causing prices to drop.
- Mortgage rates will increase: over 5% this year, 6% in 2012, and 7% by 2014.

30 Year Fixed Mortgage Rate Predictions
Here’s a few of Mr. Gardner’s thoughts for 2011 from the first of the year.
What do you think? Is this what you see happening in the area and with real estate?
Seattle Eastside Real Estate: The Glass is Half Full, Not Half Empty
It’s time to accept the reality of the market in Seattle and on Seattle’s eastside. More than likely, it’s going to be the way it is for a few more years, with single digit appreciation after that.
It’s a more realistic market. It doesn’t mean it’s bad. It’s still challenging to sell a home, but it’s not impossible. Homes are selling everyday. There have been many successful sales and there will continue to be successful real estate sales in 2011. On Seattle’s eastside, 7310 homes sold last year. Short sales and foreclosures will still happen. Which, unfortunately, means there will be people who are suffering through these tougher, more realistic times. But the majority of sales on the eastside are not short or distressed sales.
If you are thinking of selling your home, it won’t happen overnight, but it can, and does, happen.
- 2010: 9,594 homes and condos were pending (received an offer from a buyer). There were 7310 firm sales.
- 2009: 8,842 homes were pending.
- 2008: 7419 homes were pending.
Right now in the Seattle area real estate market, most homes are selling in 3-6 months. This is the now the “normal” market time to sell a home. Some homes will sell very quickly depending on the local competition and the price and condition of the home, others will languish and maybe never sell. This will be the typical pattern we’ll see in Seattle area real estate sales for the near future.
Don’t put your home on the market unless you’re clear on the pricing, clear on what the market will bear. This is not a market where you can “try” a price and then come down. If you beat the competition to start, you’ll probably make more money in the long run. Too often, sellers have “tried” a higher price and ended up selling their home for far less.
Is it moving, making a lifestyle change, or the money that’s more important to you right now? If it’s the move that’s more important because you need more space, downsizing, relocating, etc., then plan to move and do it right. Get your home gleaming and ready for the market with a value added sticker price. Your home will need to outshine the competition with a pristine look and a “beat the competition” price. If you price your home right where all your competition is, your home may not stand out.
If more money than the current market will bear is more important, then maybe this isn’t the right time to sell. However, plan on staying put for 5 or even 7 years to realize some significant appreciation in your home’s value. But remember, if there’s only 3% appreciation over 5 years, that’s 15% more. Let’s say you have a home that is worth $500,000 in this market, in 5 years at 3% appreciation, it will be worth $515,000. A 5% increase is $25,000 to $525,000. The increase is nothing to sneeze at, but with 5-7 more years of wear and tear, there’s something that needs to be done with most every house. Any future appreciation should factor in some costs for maintenance and updating.
For those buying, home ownership has gone back to what it always has been, shelter, a place to hang your hat that you enjoy. It’s a lifestyle choice, not a banking machine or something where you can make a “killing.” If you decide to buy, and some of you won’t, then evaluate your home for how it fits your lifestyle. Pick a place to live that matches your wallet and that you enjoy. Pick a place with good access to amenities: schools, shopping, parks, economic centers and easy access to commuting services. When you sell your home in the future, the home will be in a better position, literally and figuratively, to capture any appreciation. The homes located close to conveniences will become increasingly more desirable in this decade.
The glass is “half full” in Seattle area real estate. The media will continue to talk about the “bad” real estate market, but the fact is, the people who need or want to move are still going forward with their plans. Home sellers will not see the appreciation of the past, but home buyers should be able to purchase a good value and a great home. Remember if you’re a seller who’ll be buying another home, you’ll have a great chance of making a great deal on your home purchase.
It wasn’t “perfect’ for buyers back when we all thought the real estate market was great. Many of today’s sellers need to think back to when they bought their home. Buyers often competed for the same home with other buyers and paid full or over full price. Now it’s not perfect for sellers.
Sellers have to be ready to meet the market. Buyers will be looking for the best value out there. That won’t change any time soon. This is our new “normal” market.
This is the “State of Real Estate.” Our glass is “half full” rather than “half empty.” We’re still doing better than most areas here in the Seattle area.
Is This The New "Normal" for Seattle Area Real Estate?
Maybe this is how real estate is going to be in the Seattle area. Maybe we’ll have some local markets where things are “hot” just for the buyer, and, someday again, even for the seller. But maybe the Seattle marketplace will be more balanced (yellow on the map below) between the buyers and the sellers. Maybe this is the new “normal” real estate market. The majority of homes will sell in 3-6 months, some will sell for full price, some homes will sell with a small price reduction, and some will even have multiple offers. Still others will undergo a number of price reductions before selling and some will not even get an offer.
Here’s what I wrote in my November post on the real estate market. I shared similar thoughts then, so I’m wondering if we’re starting to see a pattern here.
Does this mean it’s no longer a challenge to sell a home? Absolutely not. The competition is still very stiff. There are a lot of homes for buyers to buy. A market in which it takes homes 3-6 months to sell is still a challenging, but not a terrible, real estate market. In a balanced market, some homes sell quickly for a good price, others take a lot longer to sell with a steep discount in the the asking price, and still others don’t sell at all. I’m still going to be telling home sellers to have the best home out there and expect a sale to take a long time to happen. Homes that sell have to be a really good value to be the ones that sell. Believe it or not, this is pretty typical of a more balanced, realistic market. A realistic market is not a fast paced real estate market. A realistic market will have some distressed home sellers. Although this is a cause of major concern and I am not minimizing the situation for those who are distressed sellers, the majority of eastside homes are NOT distressed sales.
So maybe this is the new “normal”? What do you think?

The State Of Seattle Area Real Estate in December, 2010

- Seattle Area Real Estate 11-30-10
———————————
What do the 3 digit numbers on the map mean?
The map is divided into the numbered areas as defined by our Northwest Multiple Listing Service (NWMLS). Downtown Bellevue is area 520 and East Bellevue is area 530, as an example.
What do the colors mean?
Red means it’s a sellers’ market, a sellers’ advantage. Homes take less than 3 months to sell.
Yellow means a balanced market between buyers and sellers. Homes on the average take 3-6 months to sell.
Green means it’s a buyers’ market. Homes take longer than 6 months to sell.
If you take each area as shown on the map and look to the area number on the side of the map, it will tell you how long it would take to sell every home currently for sale if no other home came up on the market in that area.
Seattle Economist Makes Real Estate Predictions
Thinking about the economy in 2011? Who isn’t these days?
Local economist, Matthew Gardner presented his predictions for next year’s economy and the real estate market.

(photo: Andrew@cubagallery)
Here are a few of his predictions for 2011:
Economic growth will remain slow, particularly for the first half of the year.
An “easing” in the economy should been seen as the year progresses, helping to restore some consumer confidence.
The unemployment rate will drop some, but improvement will be slow.
A 5% decline in home prices across U.S.
Inflation will be minimal, benefiting home buyers.
Interest rates should go higher, but still remain on the lower side.
What do you see happening in your area?
Hope your 2011 will be looking up!
This Past Month Seattle Eastside Real Estate Was Balanced Between Buyers and Sellers

Seattle Area Real Estate 11-30-10
The Seattle-eastside market is balanced. Surprised by that? Here’s why I say this: A balanced market is when homes on average are selling in 3-6 months. This means there was a more level playing field between buyers and sellers during that particular month, in this case November 2010. Given the news we hear, it’s surprising to think of the eastside real estate market in this way.
Does this mean it’s no longer a challenge to sell a home? Absolutely not. The competition is still very stiff. There are a lot of homes for buyers to buy. A market in which it takes homes 3-6 months to sell is still a challenging, but not a terrible, real estate market. In a balanced market, some homes sell quickly for a good price, others take a lot longer to sell with a steep discount in the the asking price, and still others don’t sell at all. I’m still going to be telling home sellers to have the best home out there and expect a sale to take a long time to happen. Homes that sell have to be a really good value to be the ones that sell. Believe it or not, this is pretty typical of a more balanced, realistic market. A realistic market is not a fast paced real estate market. A realistic market will have some distressed home sellers. Although this is a cause of major concern and I am not minimizing the situation for those who are distressed sellers, the majority of eastside homes are NOT distressed sales.
———————————
What do the 3 digit numbers on the map mean?
The map is divided into the numbered areas as defined by our Northwest Multiple Listing Service (NWMLS). Downtown Bellevue is area 520 and East Bellevue is area 530, as an example.
What do the colors mean?
Red means it’s a sellers’ market, a sellers’ advantage. Homes take less than 3 months to sell.
Yellow means a balanced market between buyers and sellers. Homes on the average take 3-6 months to sell.
Green means it’s a buyers’ market. Homes take longer than 6 months to sell.
If you take each area as shown on the map and look to the area number on the side of the map, it will tell you how long it would take to sell every home currently for sale if no other home came up on the market in that area.
There's No Sign of a Seller's Market in Seattle Real Estate

Seattle Area Real Estate Map Showing Different Market Performance 10-31-10
The lack of “red” showing a seller’s market in Seattle area real estate is no big surprise. However, it’s good to see the market was more balanced in some Seattle area neighborhoods in October.
A balanced market is when homes on average are selling between 3-6 months, which means there was a level playing field between buyers and sellers in those areas for that particular month. A buyer’s market means the homes on average are taking longer than 6 months to sell and a seller’s market means the homes take less than 3 months to sell.
A real estate market is labeled a buyer or seller’s market depending on how long it took the homes to sell that month. Since the sales can vary each month, the type of real estate market can very easily change, going back and forth between a buyer or seller advantage.
Even though it’s more challenging for sellers, there are homes that stand out and sell with multiple offers or for full price. Look at the overall real estate market, look at the market in the neighborhood, and then look at the specific home and how well it’s priced for that market. When making a pricing decision, all of this data is important.
———————————
What do the numbers on the map mean?
The map is divided into the numbered areas as defined by our Northwest Multiple Listing Service (NWMLS). Downtown Bellevue is area 520 and East Bellevue is area 530, as an example.
What do the colors mean?
Red means it’s a sellers’ market, a sellers’ advantage. Homes take less than 3 months to sell.
Yellow means a balanced market between buyers and sellers. Homes on the average take 3-6 months to sell.
Green means it’s a buyers’ market. Homes take longer than 6 months to sell.
If you take each area as shown on the map and look to the area number on the side of the map, it will tell you how long it would take to sell every home currently for sale if no other home came up on the market in that area.
It Was Mostly a Buyers' Market on Seattle's Eastside in September, 2010

King & Snohomish County Reat Estate, 9-30-10
Sellers’ markets on this map are in red and there is no red in Seattle or on Seattle’s eastside. Most of the neighborhoods are buyers’ markets, which are in green. Only two areas, Bellevue and Redmond near Microsoft, which is area 530, and area 600, which is Woodinville, Bothell, Duvall, are balanced markets. Last month, Bellevue and Redmond near Microsoft and Kirkland were the balanced markets.
A balanced market is when homes on average are selling between 3-6 months, which means there was a level playing field between buyers and sellers in those areas for that particular month. A buyers’ market means the homes on average are taking longer than 6 months to sell and a sellers’ market means the homes take less than 3 months to sell.
A real estate market is labeled a buyer or sellers’ market depending on the homes that actually sold that particular month. Since the sales can vary each month, the type of real estate market can very easily change, going back and forth between a buyer or seller advantage. Don’t count on the market staying the same each month in any area.
Remember, too, an area may be a buyers’ market and there can still be a terrific home that’s the best of the competition and sells with multiple offers or for full price. It’s always important to understand how much competition a particular home has and how well priced it is when compared to the competition. So look at the overall real estate market, look at the market in your neighborhood, and then look at the specific home and how well it’s priced for that market. Weigh all of this information when making a buying decision or a decision as to how to price your home.
What do the numbers on the map mean?
The map is divided into the numbered areas as defined by our Northwest Multiple Listing Service (NWMLS). Downtown Bellevue is area 520 and East Bellevue is area 530, as an example.
What do the colors mean?
Red means it’s a sellers’ market, a sellers’ advantage.
Yellow means a balanced market between buyers and sellers.
Green means it’s a buyers’ market.
If you take each area as shown on the map and look to the area number on the side of the map, it will tell you how long it would take to sell every home currently for sale if no other home came up on the market in that area.
Seattle-Eastside Real Estate is Mostly Green, A Buyers' Market

- King & Snohomish County Real Estate Activity 8-31-10
The Seattle-eastside has flipped back almost completely to a buyers’ market. Two areas, Redmond and East Bellevue near Microsoft and Kirkland, were more balanced real estate markets, with the market time to sell a home falling between 3 to 6 months. If you check out what the colors represent below, you can see how much of King County real estate is in the buyers’ camp right now. With today’s low interest rates and the ability to negotiate strongly because of this market trend, it’s probably a better time to buy a home now than when everyone was rushing to beat the expiration of the tax credit. The savings would be spread out over a longer time period, but would be worth far more than the one time $8000 tax credit. If you do decide to buy, remember to look for a home you can grow in that’s close to transportation, shopping, schools, and jobs. A home that meets these criteria will hold its value better.
What do the numbers on the map mean?
The map is divided into the numbered areas as defined by our Northwest Multiple Listing Service (NWMLS). Downtown Bellevue is area 520 and East Bellevue is area 530, as an example.
What do the colors mean?
Red means it’s a sellers’ market, a sellers’ advantage.
Yellow means a balanced market between buyers and sellers.
Green means it’s a buyers’ market.
If you take each area as shown on the map and look to the area number on the side of the map, it will tell you how long it would take to sell every home currently for sale if no other home came up on the market in that area.
There Were No Sellers Markets in the Seattle Area in July, 2010

King & Snohomish County Real Estate, 7-31-10
There were no sellers’ market in July. “Red” indicates a sellers’ market with homes selling in less than 3 months. If you look at the map above, all the Seattle markets are either a buyer’s market or a balanced market between buyers and sellers.
There’s a mix on Seattle’s eastside. Some markets are buyers’ markets such as West Bellevue and the Sammamish plateau cities of Sammamish, North Bend, Preston, and Fall City. Homes in these real estate markets took on average over 6 months to sell. The majority of Seattle Eastside real estate was a balanced market with homes selling between 3-6 months.
The state of the real estate market is a huge contrast from just three months ago when there was no “green” on the map at all.

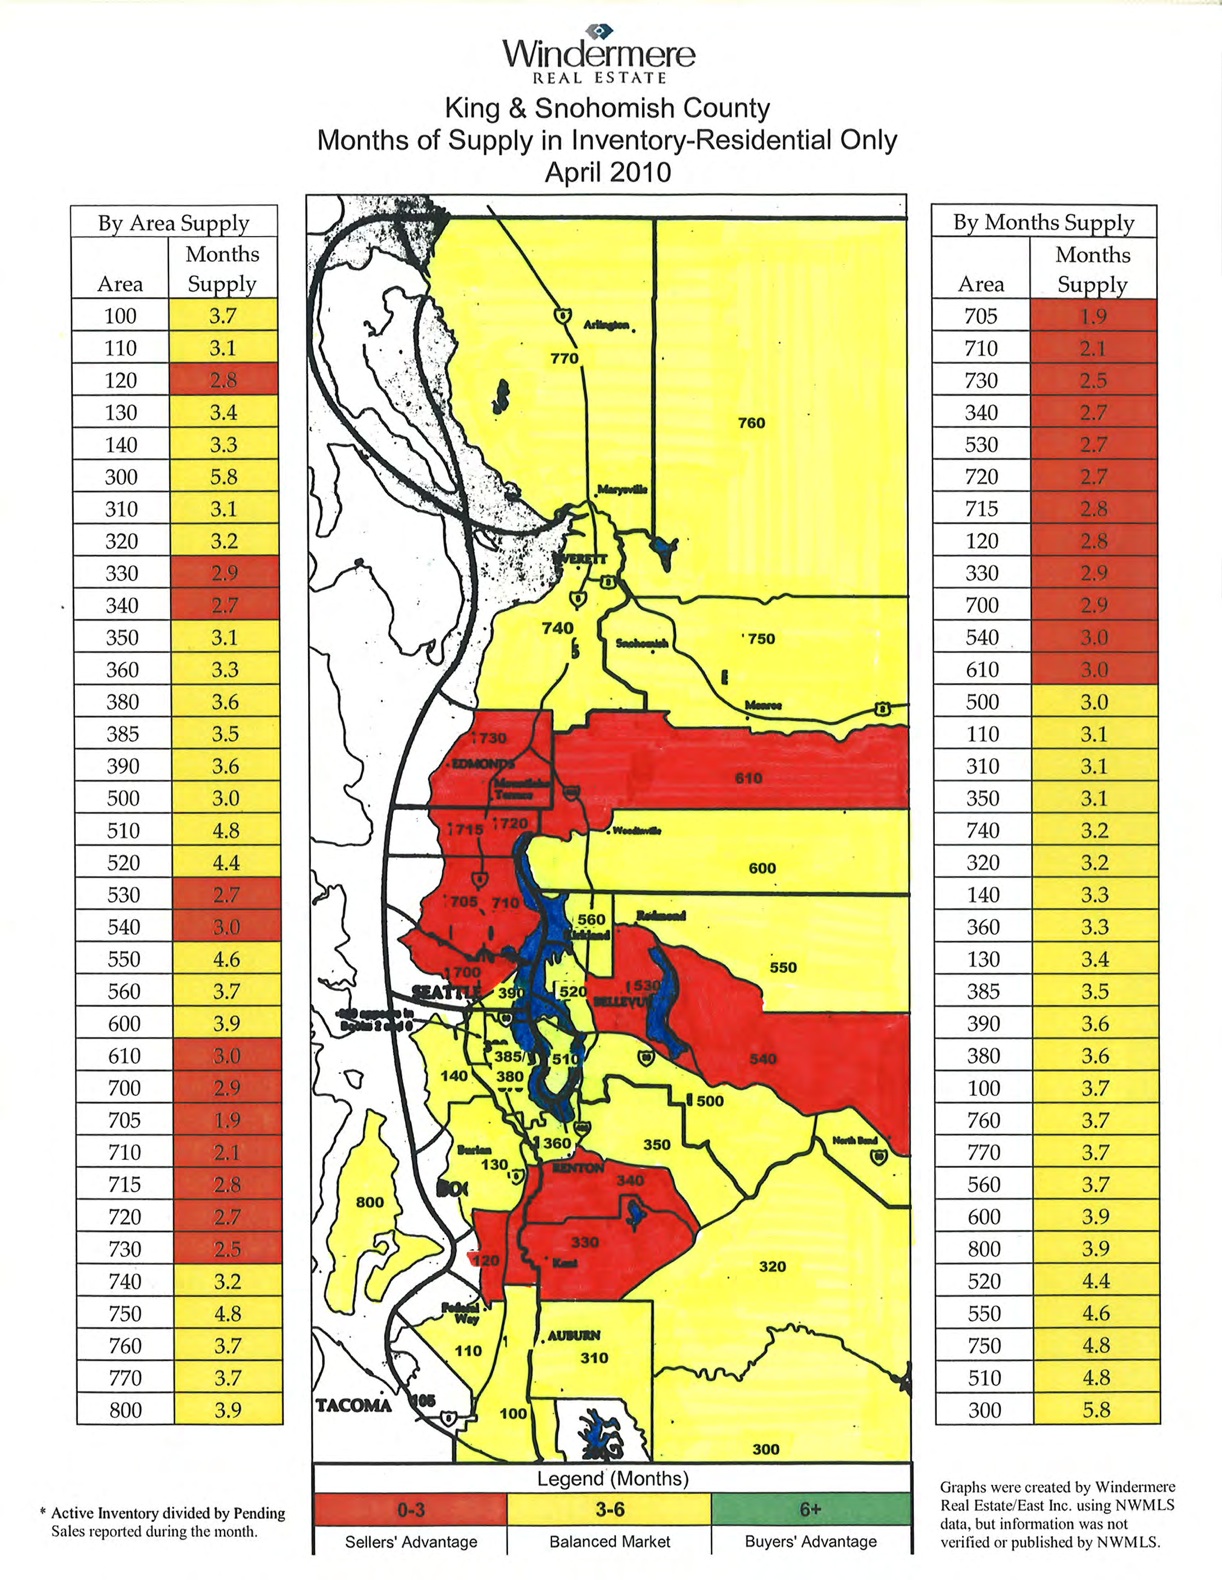
- King Snohomish Counties Real Estate Market 4-30-10
Clearly, the tax credit did its magic during that time. Is it the economy, job situation or is it the lack of urgency with interest rates slated to be low for a long time that is keeping buyers from making a home purchase? I’ve heard opinions about all three reasons as the cause for the slow moving real estate market. What do you think?
__________________________________________________________________________________
What do the numbers on the map mean?
The map is divided into the numbered areas as defined by our Northwest Multiple Listing Service (NWMLS). Downtown Bellevue is area 520 and East Bellevue is area 530, as an example.
What do the colors mean?
Red means it’s a sellers’ market, a sellers’ advantage.
Yellow means a balanced market between buyers and sellers.
Green means it’s a buyers’ market.
If you take each area as shown on the map and look to the area number on the side of the map, it will tell you how long it would take to sell every home currently for sale if no other home came up on the market in that area.
