Real Estate Sales in Bellevue, Kirkland, and Redmond, Etc Are Hot!
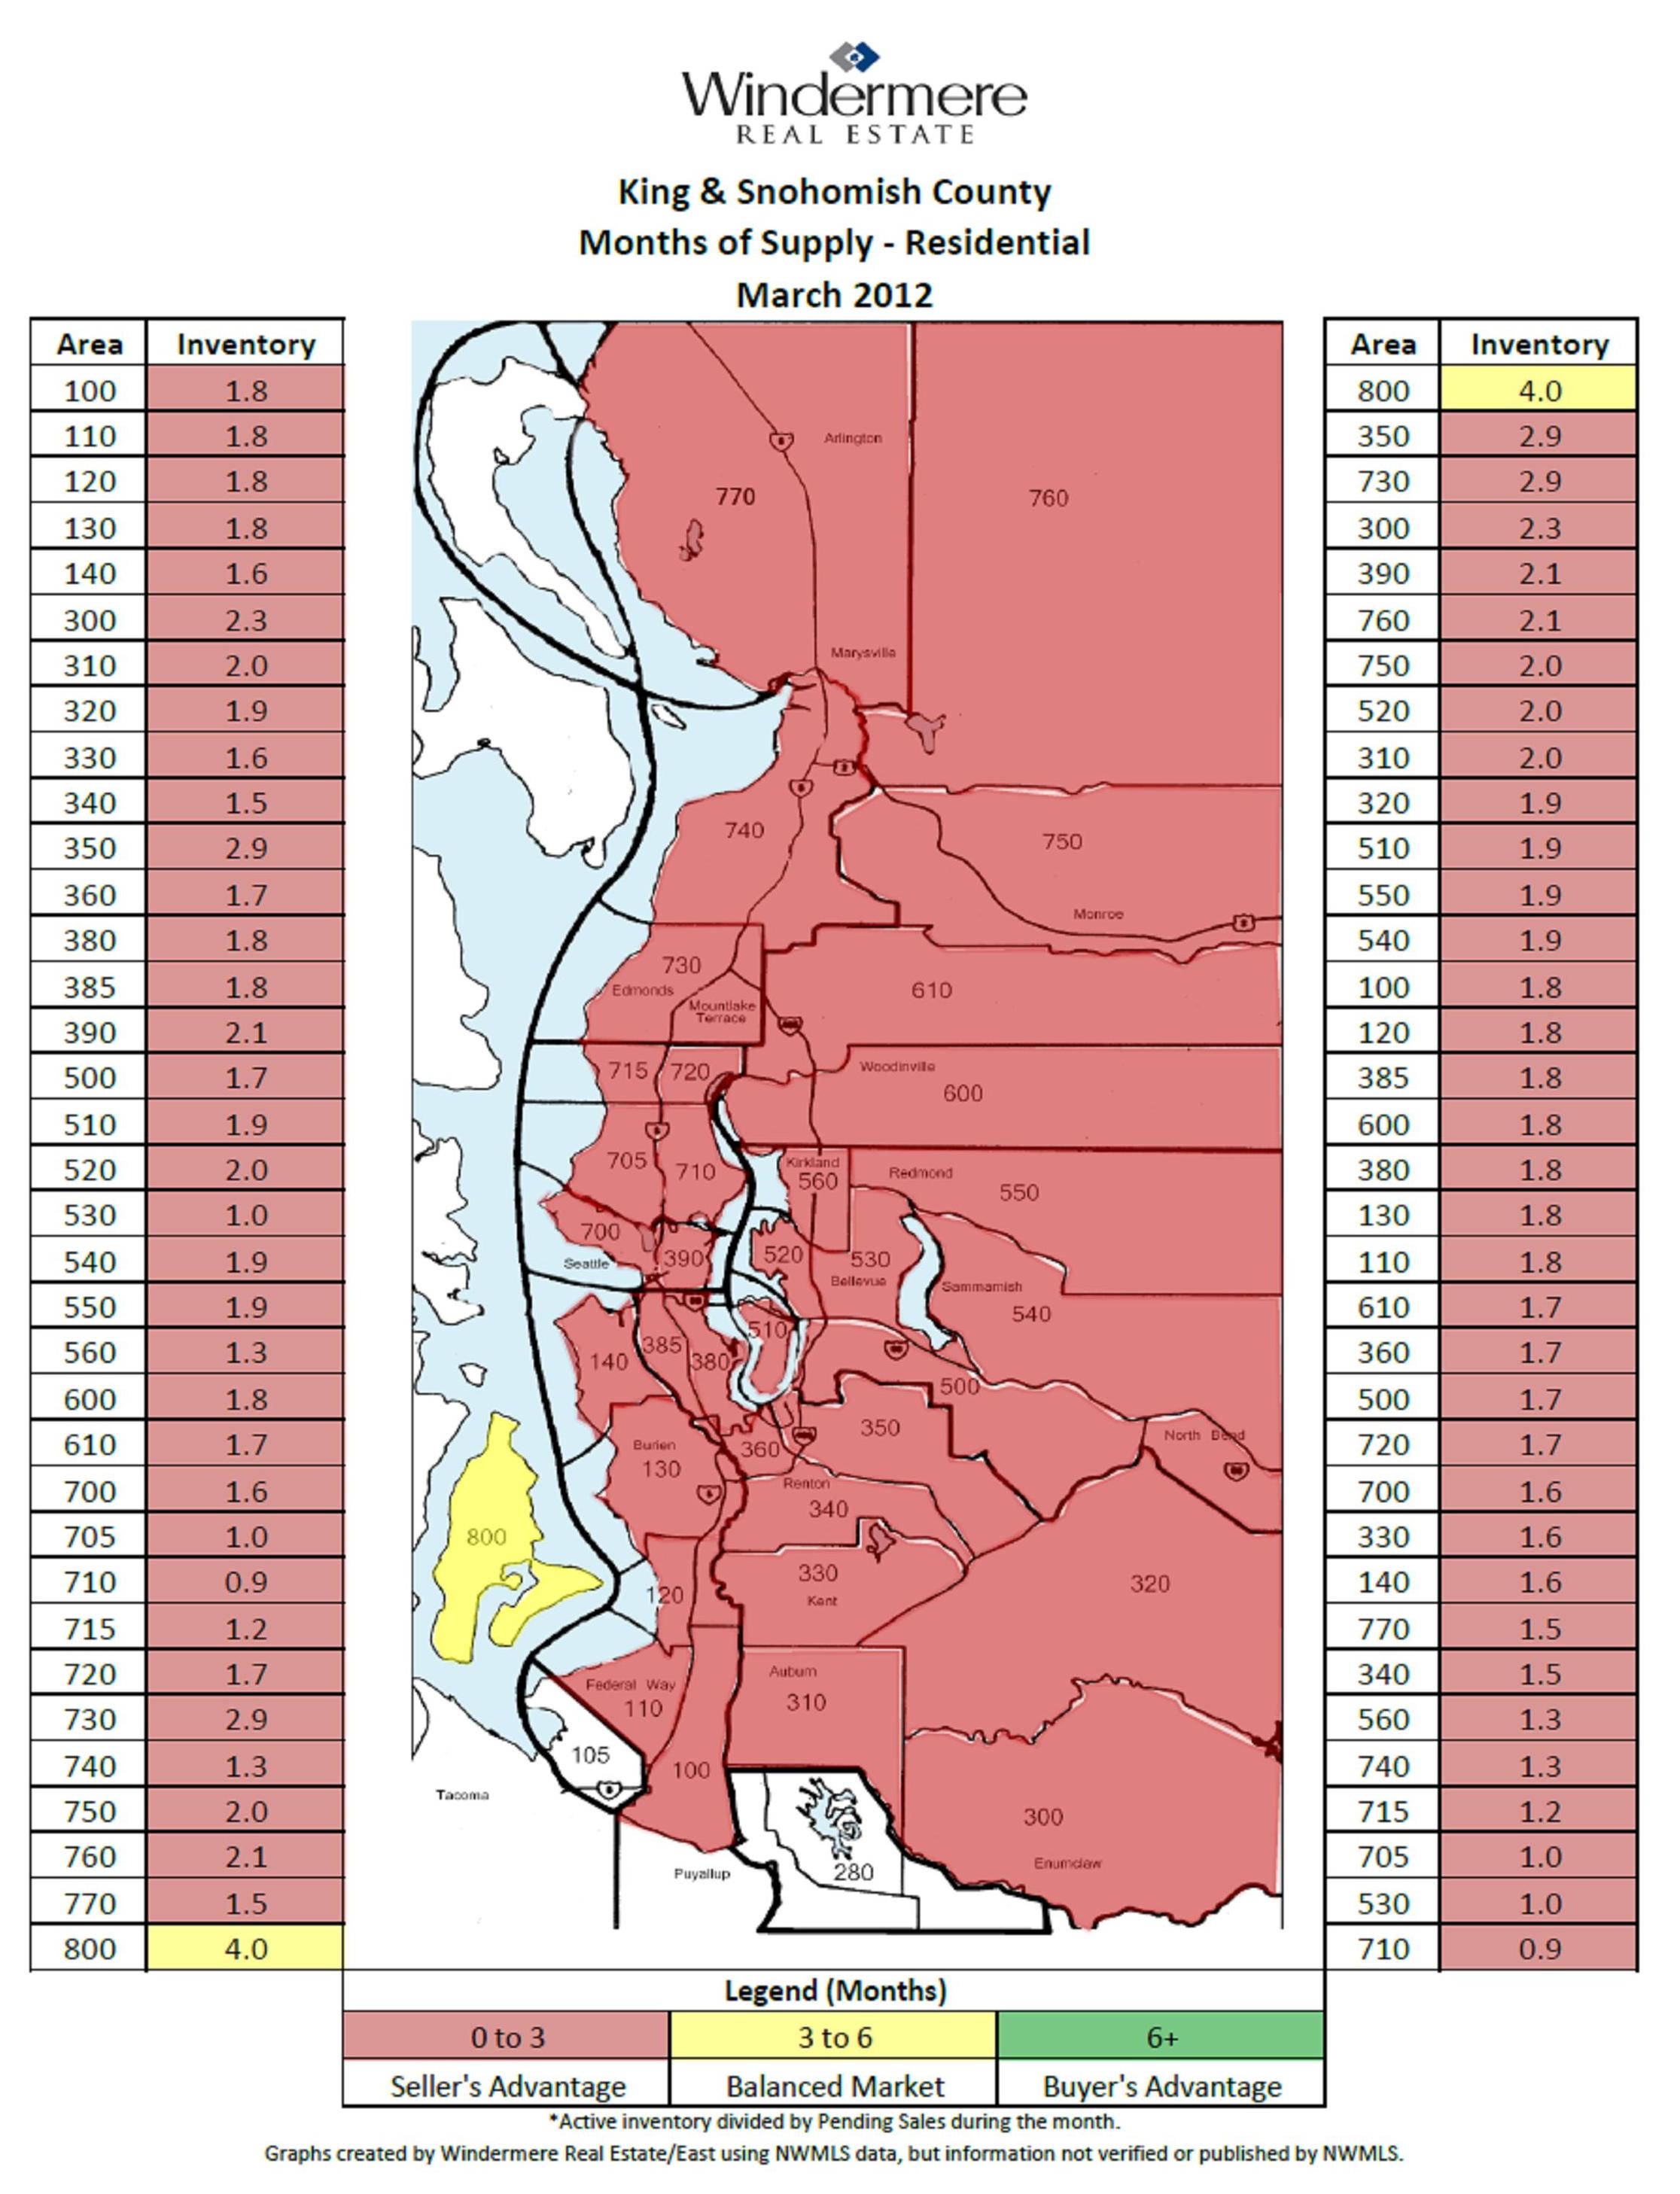
Red is busting out all over the map of Seattle Real Estate Sales! Red means it’s a sellers market in which homes, on average, are selling in less than 3 months! The numbers are really strong in all of the eastside cities, but top sales go to the 80% sales rate in Redmond and East Bellevue near Microsoft last month! Incredible odds! In every other area on the eastside over 40% of the homes sold.
Closed sales, the sales in which the new buyer now owns the house, are showing lower sales numbers because the homes that closed in March actually got offers in January or February. Expect the number of sales for each of the coming months to jump higher because March home sales will be closing in April and May.. Market time will continue to decrease as this faster sales market continues.
Pricing has still been dropping as you can see below, but should become more stable as the prices from these March sales becomes public. Some areas actually showed an increase in pricing, but remember, it is a representation of the sales that sold in March only.
Multiple offers, a shortage of homes, a huge percentage of homes selling in a short amount of time are all the buzz words for the Seattle eastside real estate market.
The cities below are reported together to follow our MLS areas (multiple listing service) information.
1. Redmond/East Bellevue
The odds of selling a home were 80%
Median sales price decreased from $476,000 to $427,000 (y-o-y)**
95 homes were for sale
A total of 76 homes sold
Days on the market: 135
2. Kirkland
The odds of selling a home were 57%
Median sales price decreased from $570,000 to $469,000
137 homes were for sale
A total of 53 homes sold
Days on Market: 83
3. West Bellevue
The odds of selling a home were 46%.
Median sales price increased from $888,000 to $1,000,000
117 homes were for sale
A total of 54 homes sold
Days on Market: 70
4. The plateau: Sammamish, Issaquah, North Bend, and Fall City
The odds of selling a home were 44%
Median sales price decreased from $505,000 to $462,000
There were 436 homes for sale
A total of 193 homes sold
Days on the market: 127
4. (tie) South Bellevue/Issaquah
The odds of selling a home were 44%
Median price increased from $510,000 to $560,000
225 homes were for sale
A total of 98 homes sold
Days on market: 99
5. Redmond/Education Hill/ Carnation
The odds of selling a home were 43%
Median sales price increased from $411,000 to $472,000
193 homes were for sale
A total of 83 homes sold
Days on Market: 100
6. Woodinville/Bothell/Kenmore/Duvall/North Kirkland
The odds of selling a home were 42%
Median sales price decreased from $423,000 to $369,000
365 homes were for sale
A total of 151 homes sold
Days on Market: 100
If you’d like more specific information about your neighborhood or home, feel free to contact either Brooks or me.
*(The odds of selling a home in each area is a result of the number of homes for sale divided by the actual number of home sales, so if 10 out of 100 homes sold, the odds of selling would be 10/100 or 10%)
** (y-o-y) median pricing is comparing year over year numbers.
A Booming Real Estate Market in Kirkland, Bellevue, Redmond And Other Eastside Cities in February, 2012
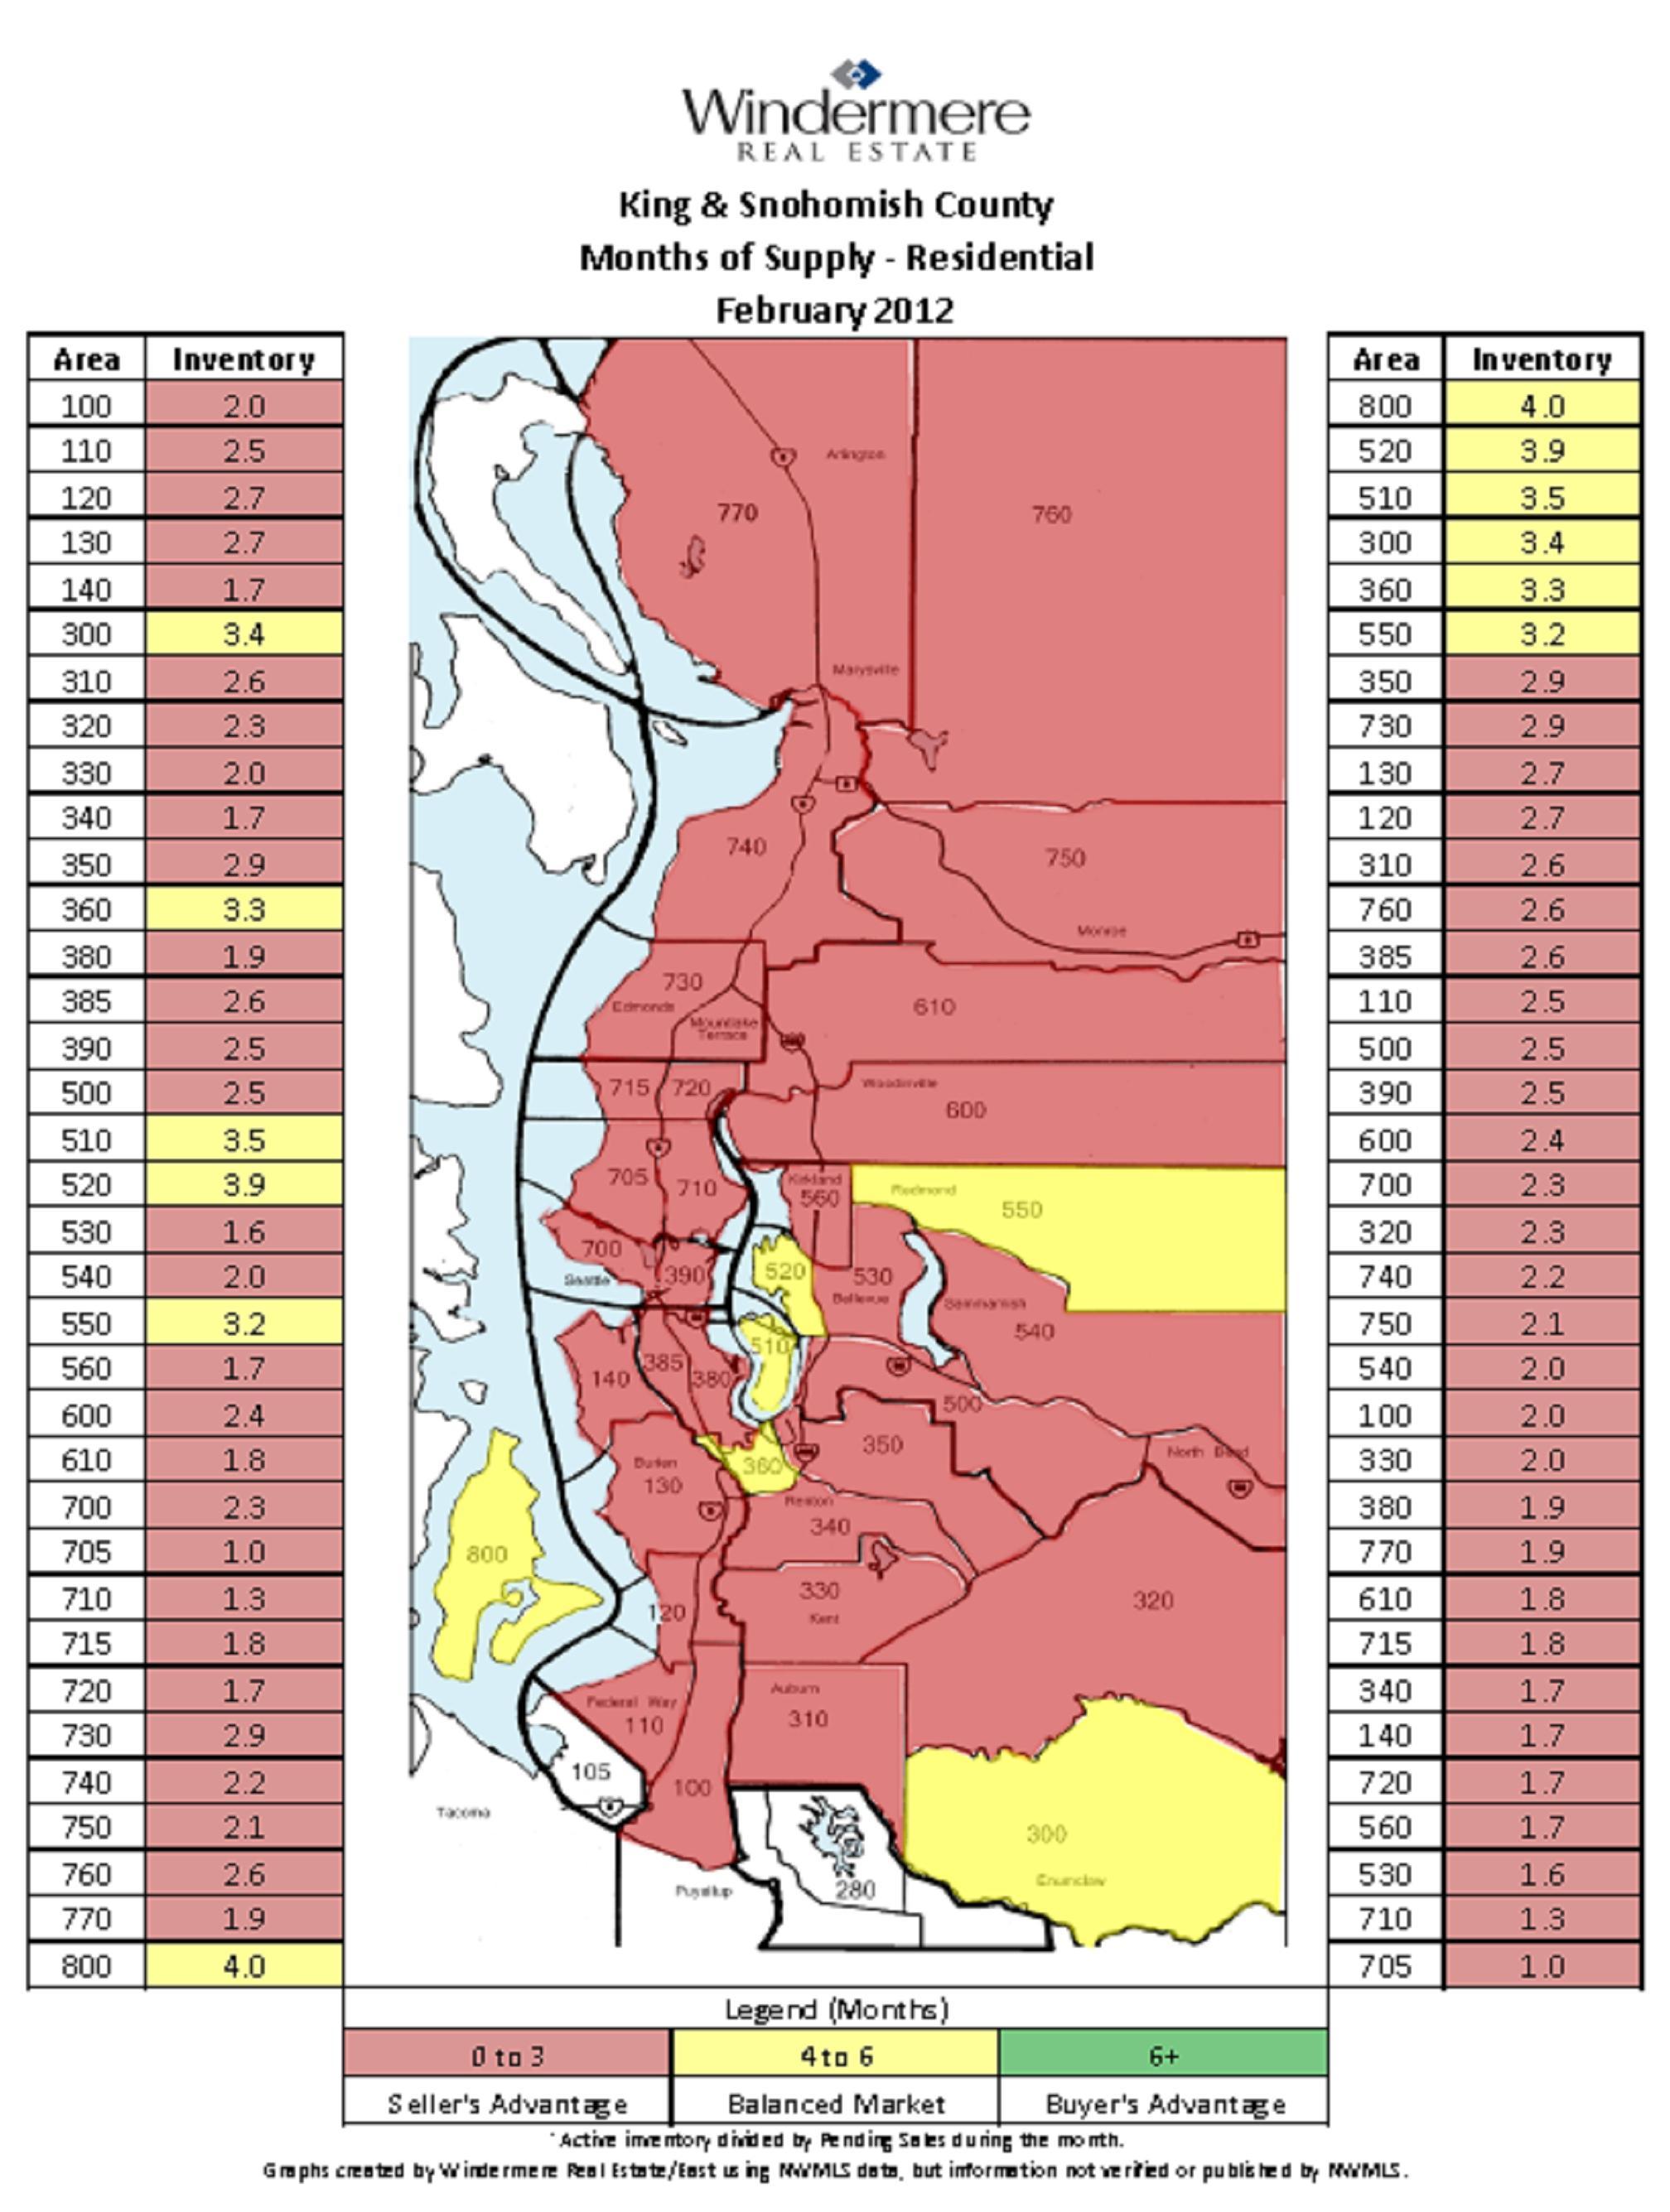 The February Real Estate Map shows a strong sellers market.
Multiple offers, low supply of homes, a huge percentage of homes selling in a short amount of time, all are happening in the eastside communities of Bellevue, Redmond, Kirkland, Issaquah, Woodinville, and Bothell. This is an exciting trend that we expect will continue as long as people feel good about the economy, Seattle companies are hiring and there is this shortage of homes for sale. The national press is jumping on the bandwagon and reporting the uptick in the real estate market. However, I believe this is not happening everywhere. We are among the fortunate areas in the country that are experiencing this positive real estate market.
Almost half of all the homes for sale in Kirkland and Redmond sold this past month! That’s astonishing odds. The cities below are grouped together to follow our MLS areas (multiple listing service). This is how our statistics are reported.
1. Redmond/East Bellevue
The odds of selling a home were 49%
Median sales price decreased from $435,000 to $400,000 (y-o-y)**
113 homes were for sale
A total of 35 homes sold
Days on the market: 84
2. Kirkland
The odds of selling a home were 48%
Median sales price decreased from $457,000 to $442,000
140 homes were for sale
A total of 38 homes sold
Days on Market: 98
3. The plateau: Sammamish, Issaquah, North Bend, and Fall City
The odds of selling a home were 40%
Median sales price decreased from $514,000 to $442,000
There were 428 homes for sale
A total of 100 homes sold
Days on the market: 121
4. South Bellevue/Issaquah
The odds of selling a home were 33%
Median price decreased from $580,000 to $525,000
239 homes were for sale
A total of 43 homes sold
Days on market: 118
5. Woodinville/Bothell/Kenmore/Duvall/North Kirkland
The odds of selling a home were 32%
Median sales price decreased from $366,000 to $360,000
368 homes were for sale
A total of 105 homes sold
Days on Market: 115
6. West Bellevue
The odds of selling a home were 20%.
Median sales price increased from $840,000 to $960,000
123 homes were for sale
A total of 15 homes sold
Days on Market: 133
7. Redmond/Education Hill/ Carnation
The odds of selling a home were 4%
Median sales price increased from $382,000 to $515,000
205 homes were for sale
A total of 29 homes sold
Days on Market: 152
If you’d like more specific information about your neighborhood or home, feel free to contact either Brooks or me.
*(The odds of selling a home in each area is a result of the number of homes for sale divided by the actual number of home sales, so if 10 out of 100 homes sold, the odds of selling would be 10/100 or 10%)
** (y-o-y) median pricing is comparing year over year numbers.
The Seattle Eastside Condo Market Was Great in February, 2012
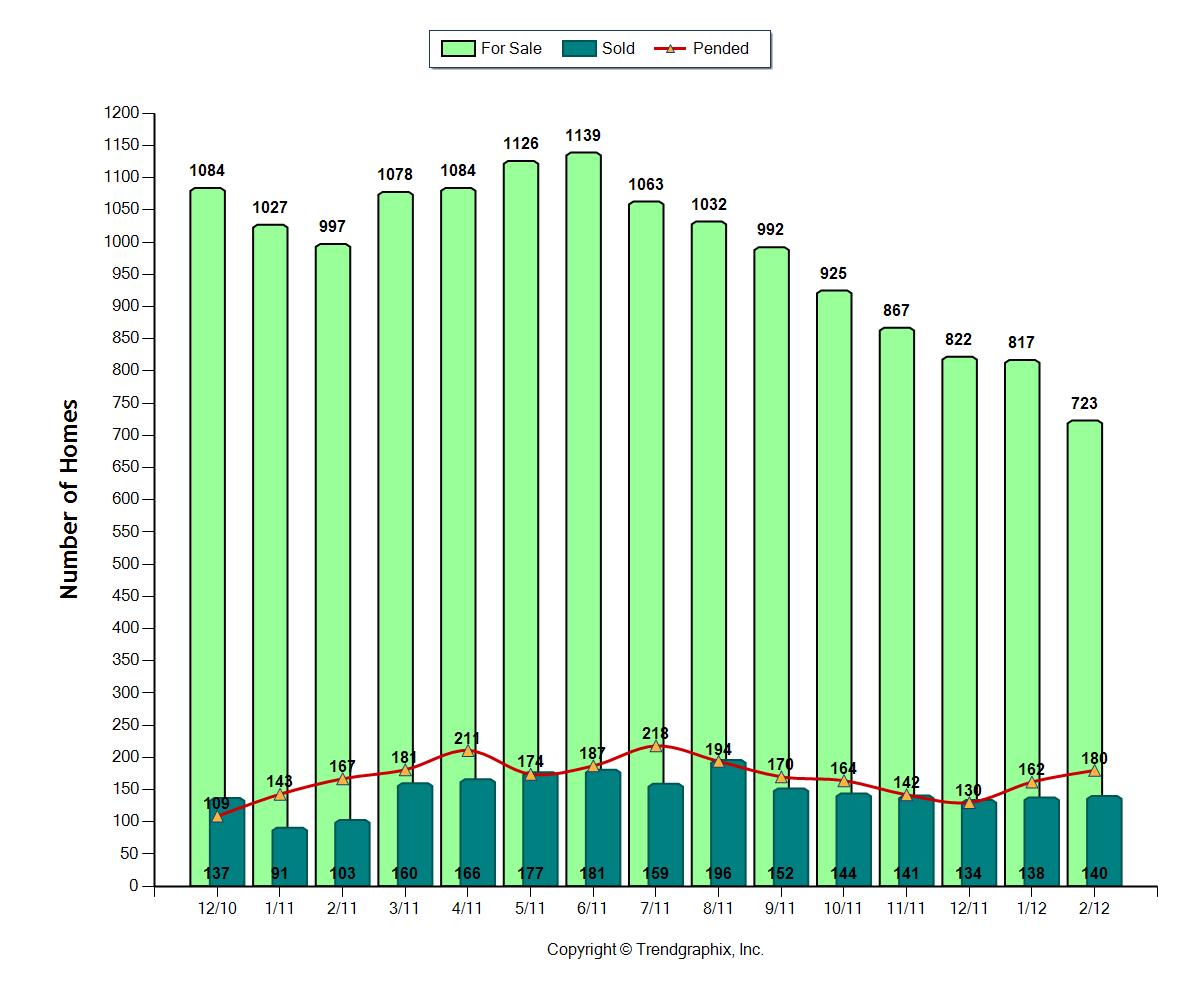
If you have a condo to sell on Seattle’s eastside, now is a great time to put it on the market. If you’ve hoped to move and have felt as if you couldn’t do so over the last few years, things are different now. Competition among sellers has dropped dramatically, because there are so few condos for sale. There were only 723 condos for sale in all the eastside cities of Bellevue, Redmond, Kirkland, Woodinville, Issaquah, etc. Just a few years ago, there were twice as many condos for sale.
Prices are not going to go back up any time and, more than likely, will no longer continue to drop. If your condo is underwater and/or you can’t or don’t want to sell because you’re taking a huge loss, that’s unfortunate. But for those who have contemplated a move up or out of the area, this is the best time to put your condo on the market in the last 5 years.
If you’re a buyer, condos haven’t been this affordable for about 6-7 years, so it’s a great time to buy. Most real estate gurus and economists think we’re at the bottom of the market. The situation varies dramatically in different parts of the country. Seattle is one of the bright spots in the economy, so our market is doing well. If you’re waiting for prices to go down even more, it doesn’t sound like that will happen, particularly in the Seattle area. We’ve been hit over the head with this fact since so many of the condos and homes are now selling with multiple offers. As soon as that happens, we know we were at bottom.
Last month, 25% of all the condos on the market sold. Condos sold, on average, within 89% of the original asking price.
Multiple Offers for Seattle Eastside Homes in February 2012!
-

- When I check listings each day, I notice there are many homes that sell within a matter of days. Most days when I check listings, I’ve noticed they’re fewer new listings than sales. Just the other day there were 49 new listings on the eastside and 69 sales. More homes are selling than are coming on the market.
- The supply of buyers outweighs the supply of homes right now, which results in multiple offers for a home. This was common before the market crash and is now becoming a common phenomenon again here in the eastside cities of Bellevue, Kirkland, Redmond.
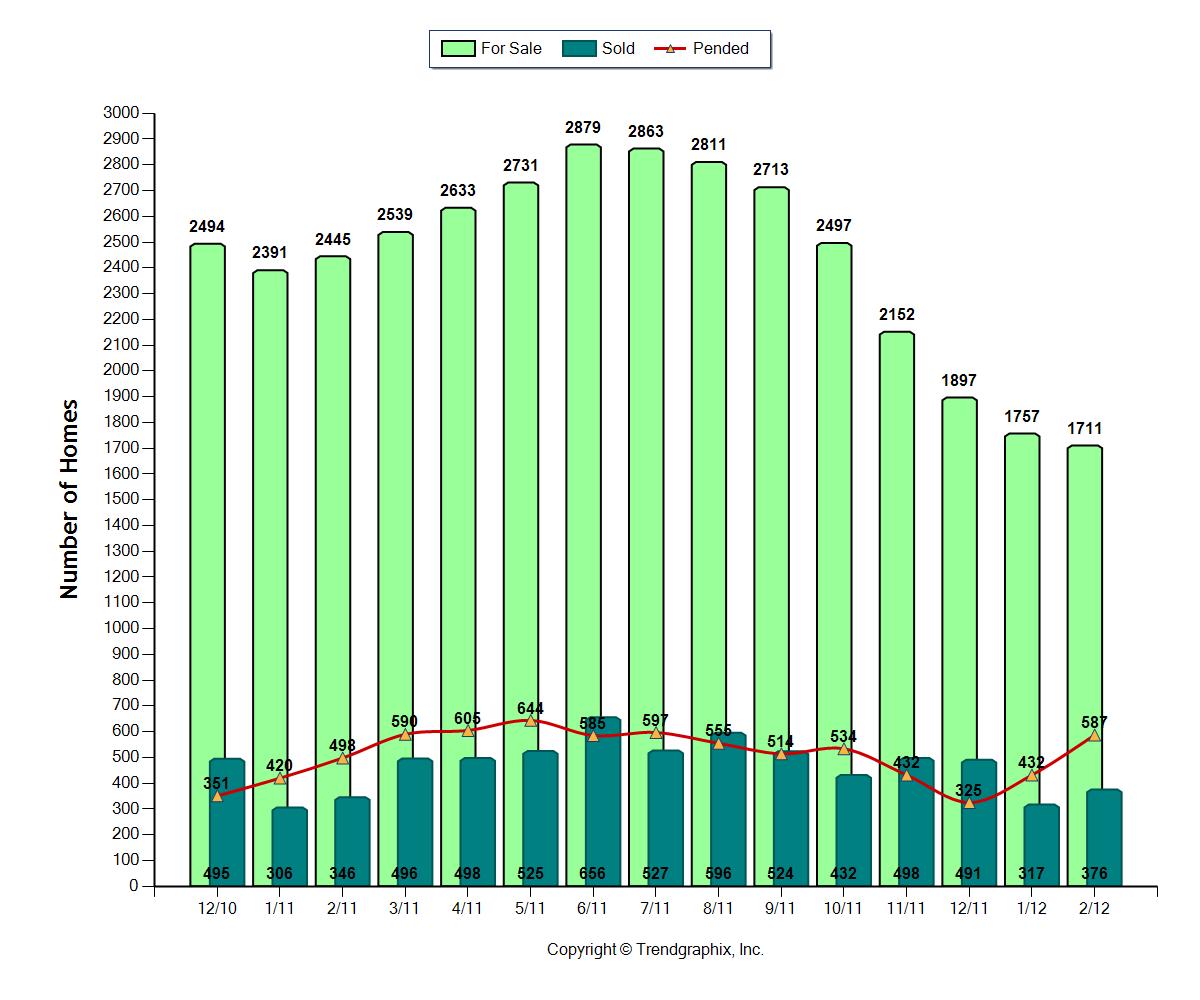
- As I mentioned last month, it’s surprising to see fewer homes on the market than in January. Usually the number of homes for sale follows the same trend that we see in the chart for 2011. As most years progress, there are more homes for sale each month, with the number peaking sometime in the summer. This year we’ve not seen this pattern. It’s pretty unusual at this time of year to see the number of homes for sale actually be a lower number than the previous month. This week the number of homes for sale in all of King County dipped below 7000. We started the year with about 7500 homes for sale, so homes are selling at a pretty fast clip.
- Does this mean that home prices are going up? Even with multiple offers, not all of the homes are selling for full price. There are some homes, though, that are in demand, are truly special or are priced incredibly well which can and do sell for more than full price. Prices on the eastside are actually down about 2% from last year.
The Seattle-eastside real estate market was hot in February. Buyers were lining up and multiple offers were often the norm. Multiple offers? Yes, multiple offers.What happened to the supply of homes on the eastside?
In the eastside cities of Bellevue, Kirkland and Redmond, etc, sellers who are able to hang on to their homes and choose not to sell are waiting, particularly if they paid more for their homes. The shadow inventory of foreclosures, is still a shadow at this point. There are foreclosures, but the eastside real estate market is not glutted with them.
This February there were 734 fewer homes, about 31% less, for sale on the eastside than last year. With almost 1/3 fewer homes on the market, it’s no big surprise that multiple offers are happening. Not only are fewer homes on the market, but more are selling than last year. Almost 100 more homes sold this February than last.
The wrap up February, 2012 Seattle-eastside real estate:
- 31% fewer homes were on the market in February this year than in 2011.
- The average time a home took to sell was 118 days.
- Sales prices on average were 8% below the seller’s original asking price.
- 34% percent of the homes for sale this January received offers and sold.
What’s happening in your neighborhood? Is the real estate market off to a better start this year?
*The numbers are a result of the real estate sales activity that happened that particular month only. In order to see a trend, it is important to look at a number of months together. One month is only indicative of that particular month’s sales.
Stayed tuned to see if this hot real estate market continues.
How Was The Seattle Eastside Condo Market in January 2012?
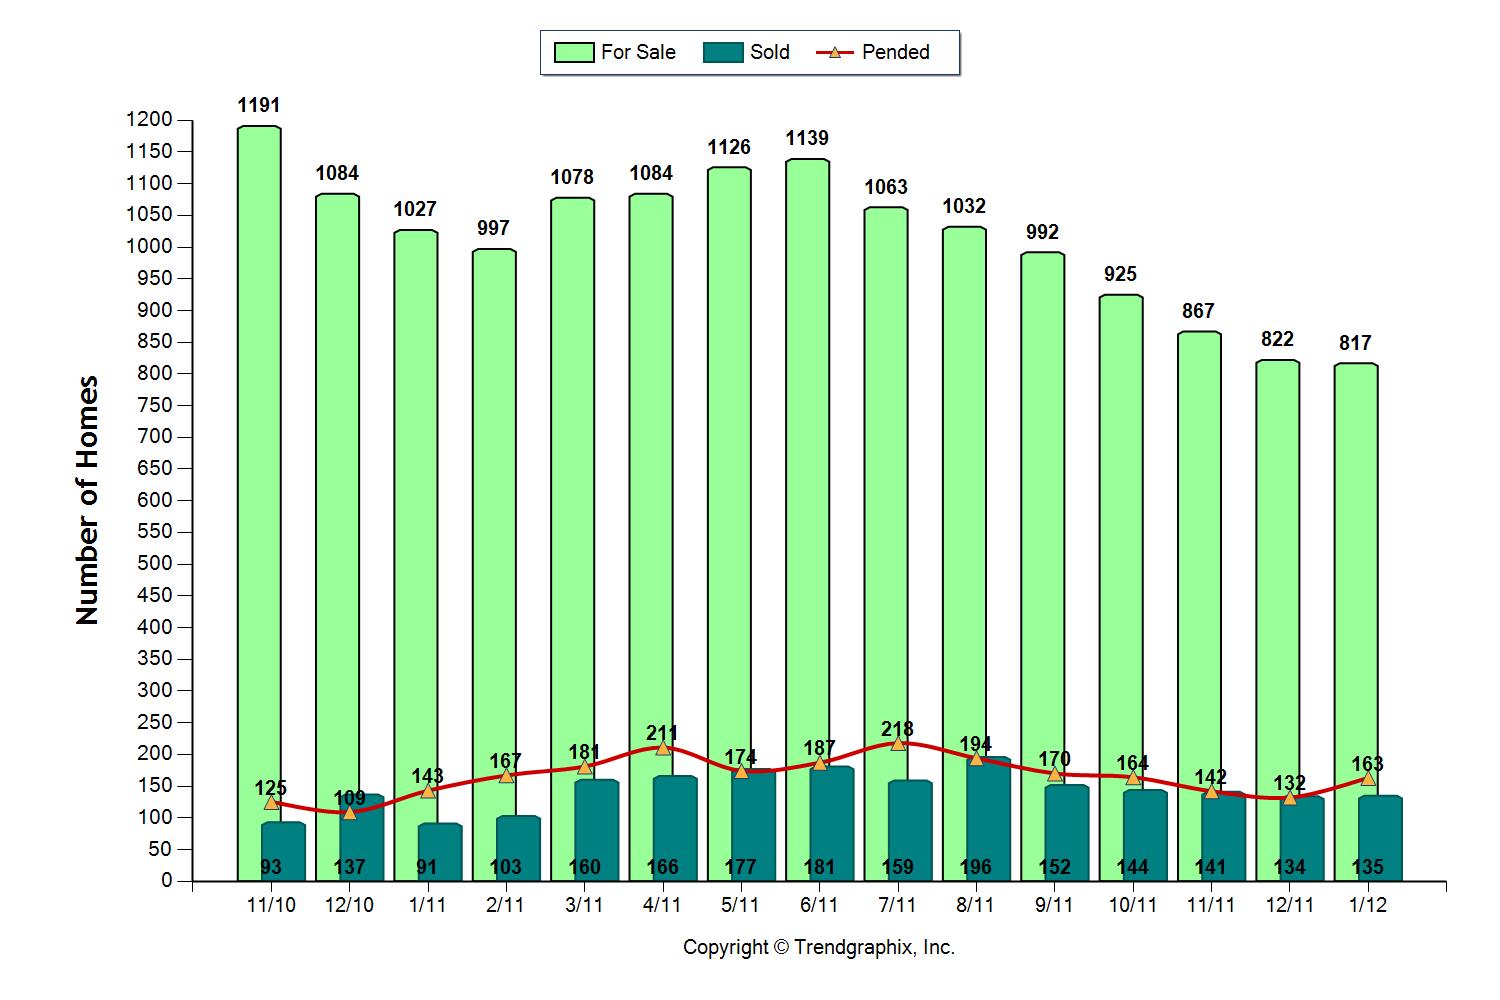 The Seattle-Eastside condo real estate market in the cities of Bellevue, Kirkland, Redmond, etc was even better in January than December of last year. This is not terribly surprising. When the calendar rolls around to a new year, buyers minds turn to real estate and home buying.
The number of condos for sale on the eastside was almost the same as in December. However, 31 more condos sold in January than in December. Interestingly, there were 247 new listings, but with the number of sales happening and other condos coming off the market, the supply has remained static. The demand has been far greater. The well priced and well maintained condos are selling as fast as they are coming up on the market.
Ironically, 20% fewer condos were on the market in January than a year ago.
As I’ve mentioned before, expect this year’s condo real estate market to be the strongest we’ve had for sales in 5 years. In January, 20% of the available condos sold which is equal to the highest percentage of sales in July of last year. Condos were on the market an average of 133 days and sold within 89% of their original asking price. Surprisingly, the median price dropped from $235,000 last year to $168,000 this year.
I truly think this only represents the fact that the majority of condos that sold in January happened to be less expensive than those that sold last January. I don’t think prices have dropped that much. I look forward to seeing the price point for condo sales when we have February’s statistics available. So don’t give up hope just yet. Prices are down for everyone, whether it’s a house or condo, but it may not be as bad as January’s median pricing suggests.
As we’ve mentioned before, expect this year’s condo real estate market to be the strongest we’ve had for sales in 5 years. The lack of supply should help to spur the market on. Happy condo hunting!
How Was The Seattle Eastside Real Estate Market in January, 2012?
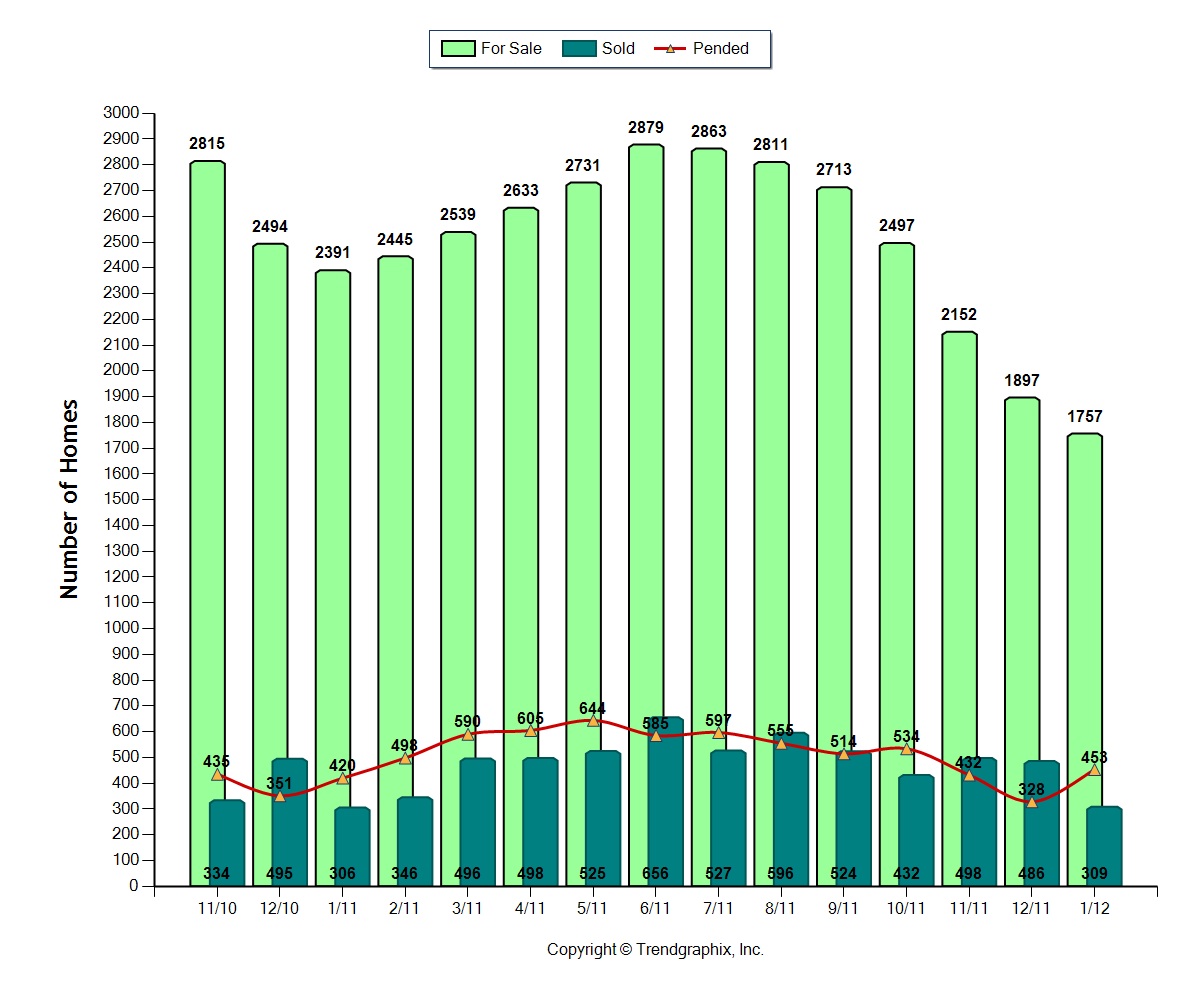
Real estate on Seattle’s eastside had a great start to 2012. Pending sales were up by 38% and there were 26.5% fewer homes on the market this year than in January, 2011! This is a recipe for a positive real estate market here in the cities of Bellevue, Kirkland, Redmond, Issaquah, Sammamish and Woodinville. In January, 2011 there were over 2300 homes for sale, in July 2011 there were 2879 homes for sale, and this past January there were just 1757 available homes! There were 1000 fewer homes for sale in January, 2012 than in July of 2011. That’s a huge difference. In the first 7 weeks of 2012, the number hasn’t change much, remaining fairly stable. Usually by the this time of the year, we’ve seen a jump in the number of homes for sale.
We expect this year to be a fast paced market for the homes that are priced well and show well. We can already see the increase in activity with one of our listings. We recently listed a home and 20 different groups came to the open house. This means there are lots of buyers out there actively looking for a home.
I also think most people feel like the worst is behind us and it is safe to go out again and buy a home. NPR had a piece with positive economic news on several fronts. Housing starts are up and unemployment is down.
The wrap up for January, 2012 Seattle-eastside real estate:
- 26% fewer homes were on the market in January this year than in 2011.
- The average time a home took to sell was 105 days.
- Sales prices on average were just 9% below the seller’s original asking price.
- 26.5% percent of the homes for sale this January received offers and sold.
As in December, the actual number of homes sold did not change much. Last year 420 homes sold. This year 453 sold. The difference? There was much more competition last year because there were 634 more homes on the market! The lack of supply definitely contributes to a faster market.
What’s happening in your neighborhood? Is the real estate market off to a better start this year?
*The numbers are a result of the real estate sales activity that happened that particular month only. In order to see a trend, it is important to look at a number of months together. One month is only indicative of that particular month’s sales.
Predictions for 2012 Real Estate on the Eastside-Bellevue, Redmond, Kirkland, Etc.
With the start of the new year, we’re seeing a more positive attitude out in the marketplace. It’s amazing what a new year can bring in attitude and outlook for people. Many are making choices to move because they want or need to do so. For some, the price issue is taking a back seat to the need to move. We have several clients who plan to move because they just got married and want a new home or would like to live in the city, downsize or relocate. These moves are lifestyle choices. Some will lose money, while others will make a profit on their home sale. Lifestyle wants and needs trump the monetary outcome for some. Truthfully, if homeowners can make a choice as to whether to sell or hold, they are the fortunate ones.
What’s on the horizon for 2012? As I was driving to a meeting recently, I heard a piece on KPLU about the expected improvement in the Puget Sound economy.
Dick Conway, an economic forecaster. had spoken at the 40th Anniversary Economic Forecast Conference in Seattle. Here are five reasons Conway thinks the future is bright:
- Boeing is showing strong employment, with the 737 MAX and the 787 being built here, the labor peace pact, and strong bonuses. Overall, it is a very nice scenario for the Puget Sound Economy.
- Job growth in the region is generally outpacing the nation. The strength of both Boeing and Microsoft causes a “multiplier effect,” bringing more jobs with them.
- Retail sales numbers have been a pleasant surprise. Conway predicts a 5.9 percent increase in 2012 and a bit more than 3 percent growth in 2013.
- Foreign exports are leading the recovery and Washington state is the nation’s top exporter, thanks again to Boeing. (Microsoft is also a factor here.)
- The Puget Sound is home to many strong local companies.
Matthew Gardner had a fairly optimistic view for 2012 real estate in the Seattle area:
When combined with improving economic conditions, I would not be surprised to see several markets exhibit modest price growth in 2012. That said and, as we all know, real estate is all about location; therefore I do not expect that price recovery will be equal across all markets.
He tempers this line of thinking with the two elephants in the room: the expected supply of distressed sales that will hit the market and the difficulty of obtaining financing:
If this is actually the case, then why aren’t prices higher? Well, there are still a number of anchors that are holding us back. The first of which is the shadow inventory in the shape of distressed homes. Many foreclosures have been trading at below market value and, in some cases, below replacement cost. This naturally holds down values.
Secondly, and equally as important, are the continued issues with obtaining financing for the purchase of a new home. It remains remarkably difficult to get a mortgage, which has led to an unusually high percentage of proposed purchases falling through.
With the new year and promising economic news, we expect Seattle-eastside real estate to be the strongest since 2007. Home sales should be steady even as inventory rises into the summer. Prices, of course, may stay about where they are for now. The key to pricing will be the supply of homes on the market. The more homes, the more competition for buyers and the more flexible sellers will need to be about pricing. With fewer homes on the market and steady demand, prices should stabilize. If prices do go up, most likely it will be in the areas that are close-in, areas which are considered desirable locations. Expect distressed sales to temper the pricing this year. The number of homes for sale and pricing will vary from neighborhood to neighborhood. The eastside is filled with real estate micro-markets and they don’t perform in the same way.
If there are any price increases, they will be minimal, but if there are increases, we will be shouting this from the rooftops! Because we watch market trends so carefully, our sellers will be among the first to know about any price increases. You will, however, hear us shouting that 2012 is expected to be our best market in the last 4 years.
Our predictions:
- Prices should not drop further.
- Some homes will be the “hot” ones because of price and condition. These homes will sell quickly and some will have multiple offers.
- Other homes and neighborhoods will move more slowly because of price and location.
- Local companies, such as Amazon and Microsoft, will continue to move people to the area.
- The supply of homes for sale will increase as the year heads to spring and summer, however, there are some homeowners who will choose to hold for a number of years. The supply should not increase as dramatically as it has in the last few years.
- Distressed sales will continue to be a significant part of the supply and will continue to affect pricing statistics. However, pricing will be stronger for those homes that aren’t distressed sales.
- There will be a more balanced market between buyers and sellers.
- The wide range of activity indicates a normal, active real estate market on Seattle’s eastside.
What do you think will happen real estate in cities such as Bellevue, Kirkland, and Redmond? Will prices go up, down or stay the same? Do you see a good market in your area?
2011 Ends With The Fewest Homes for Sale in 4 Years on Seattle’s Eastside
We have to go back before the bubble burst to February 2007 to find so few homes for sale on Seattle’s eastside! There’s a healthy number of homes for sale on the eastside, 1897 at the close of December, so there are good choices for buyers. With fewer homes on the market, it spurs the competition among buyers for the best homes and should help stabilize prices. In some neighborhoods, there aren’t any homes for sale right now.
Pricing is becoming more affordable for a new set of buyers who are coming to the market for the first time. A mortgage payment that would have bought a home for $500,000 in 2008, would now cover the purchase of a home in the mid-$600,000s!
Here’s a snapshot of Seattle-Eastside real estate in December, 2011 compared to 2010:
- 24% fewer homes were on the market.
- The time it took to sell a home went from 129 days to 111 days this past December.
- Sales prices were 8% below the seller’s original asking price, while in 2010 they averaged 10% below the asking price.
- Eighteen percent of the homes for sale this December received offers and sold, while only 14% received offers in 2010.
- 338 homes sold in 2011, while in December 2010, 351 homes received offers.
The actual number of homes sold did not change much, which, surprisingly, is almost always the case. The difference was not in the number of sales, but in the number of homes for sale. There were 597 fewer homes for sale at the end of 2011 than 2010. When there are fewer homes for sale, there are fewer “for sale” signs out in neighborhoods. The “sold” signs also pop up a lot faster.
When the supply increases, there’s increased competition and homes take longer to sell. Most people think homes are not selling because there are more real estate signs and they stay posted in yards for a longer time. This is not the case. Homes are selling, but there’s just more competition which makes it feel as if the market is slower.
The real difference then is the supply, the number of homes for sale. If there’s a smaller supply the market will seem faster because these homes will sell faster. If there is a larger supply, there is more competition and the market will seem slower because it takes longer to sell a home. In both markets, though, the number of homes that sell does not vary all that much. It is the Supply that varies and changes what we think is happening in the real estate market. The above chart confirms this as you can see the supply changes far more dramatically than the number of sales, which are shown at the bottom of each month.
In my next piece, I’ll talk about how Seattle-eastside real estate should play out for the coming year. Have a great 2012 and hope you are able to make it through this week’s snow.
Since real estate is neighborhood specific, if you’d like more information about your home, contact us, we’re here to help.
*The numbers are a result of the real estate sales activity that happened that particular month only. In order to see a trend, it is important to look at a number of months together. One month is only indicative of that particular month’s sales.
Sellers in the Seattle Area and On the Eastside Start Your Engines!

At the start of 2012, there are less than 8000 homes for sale in King County! Compare this number to the start of the last three years:
- 2011: 10,008 homes for sale
- 2010: 9726 homes for sale
- 2009: 11,363 homes for sale
The old law of supply and demand is at work here and is starting to favor sellers more than it has for years. There’s a 3.6 months supply of homes for sale in King County. This means there’s a balanced market between buyers and sellers with the market tipping towards the sellers. (Less than 3 months of inventory indicates a sellers market.)
On Seattle’s Eastside, the market is looking really strong, particularly around the Microsoft area of East Bellevue and Redmond. The number of homes for sale has dropped dramatically.
What should buyers and sellers expect in the first quarter of 2012 on Seattle’s eastside?
Fabulous interest rates.
A more positive real estate market.
The market will continue to be affected by short sales and foreclosures.
Home prices are not up nor will they go up. There is no indication on the immediate horizon that indicates anything about price increases. On the flip side, the lack of supply of homes for sale helps to stabilize the market and prices. Fewer homes means more competition, which helps pricing. The real estate market will vary neighborhood by neighborhood. One size does not fit all.
Location matters. Homes close to economic centers that offer a good commute, good schools, and good amenities will be more in demand.
Condition matters. Homes should go on the market in the best possible condition to command the best price.
Some home sales will be good deals depending on the available competition, the condition of the home, and the seller’s motivation.
Some homes will sell for full price, in a matter of days, and with multiple offers This, too, will depend on the same factors mentioned in my previous statement.
It is important to know your area. Buyers and sellers should both be aware of the competition, pricing, and condition of nearby homes to determine the value of a specific home.
Homes need to be priced right or they will not sell. I heard a seller say the other day, “I’m not going to give away the farm.” If you, as a home seller, have far more money into your home than it’s worth and you have no interest or are financially unable to price your home to meet the market, then this is not be the time to sell your home.
Gee, it sounds like a normal real estate market to me! What do you see happening in your market place?
Was There Any "Good" in November’s Real Estate News on Seattle’s Eastside?
If you read the news about Seattle real estate, it could make you crazy! It’s hard to determine what’s true and what is hype. There’s some tough news that dominates and then there is some news that is actually good. You know how it is, bad news always travels faster than good news, no matter what the topic. Our real estate news is a mixed bag, but it’s good to know it’s not all bad news. So let’s deal with the “bad” news first, since that seems to be most people’s hot button. And, by the way, if you read beyond the headlines, it may not be as bad as it seems.
True, our prices are down. That’s the elephant in the room. The “king” of the bad news. There is no getting around it. But if you look at the pricing issue more closely, it’s not as dire as it seems. Take out the distressed sales and prices for individual home sellers are down, but not as much.
• Bank-owned houses accounted for 20 percent of all King County sales in November, up from 14 percent a year earlier. Those houses sold for a median price of $177,000, down 18 percent from $216,000 in November 2010.
• The median price of short-sales houses dropped 17 percent, from $305,000 to $260,000.
• But other, “nondistressed” sales saw a much smaller price decline — 2.5 percent, from $399,000 to $389,000.*
Prices are down, but depending on the area, not as badly as one would think. The eastside is one of the areas where it is not as bad because people are still moving here for jobs and buying homes. If you look at the chart above, over 400 homes have sold on Seattle’s eastside each month this year. This November saw higher sales than last November.
The good news for Seattle-eastside real estate:
- 24% fewer homes were on the market in November this year than in 2010.
- The time it takes to sell a home went from 106 days last November to 60 days this November.
- Sales prices on average were just 4% below the seller’s original asking price this year, while last year they averaged 7% below the asking price.
- Twenty-nine percent of the homes for sale this past November received offers and sold, while only 19% received offers in 2010
- There’s no getting around that, but with less homes on the market, it spurs the competition among buyers for the best homes.
- Pricing is becoming more affordable for a new set of buyers who are coming to the market for the first time.
Truthfully, the actual number of homes sold did not change all that much. Last year 435 homes sold. This year 458 sold. The difference? There was much more competition last year because there were 342 more homes on the market.
So remember, look at all the facts, not just the headlines when talking about real estate. Review the data that applies to your specific neighborhood to make a decision about the market.
What’s happening in your neighborhood? Is there any good news mixed in with all the negativity about the real estate market?
*The numbers are a result of the real estate sales activity that happened that particular month only. In order to see a trend, it is important to look at a number of months together. One month is only indicative of that particular month’s sales.
 Facebook
 X
X
 Pinterest
 Copy Link
