For BuyersFor SellersMarket StatisticsReal EstateWindermere Real Estate August 15, 2013

July Brought Sunny Weather and Great Real Estate Sales on Seattle’s Eastside

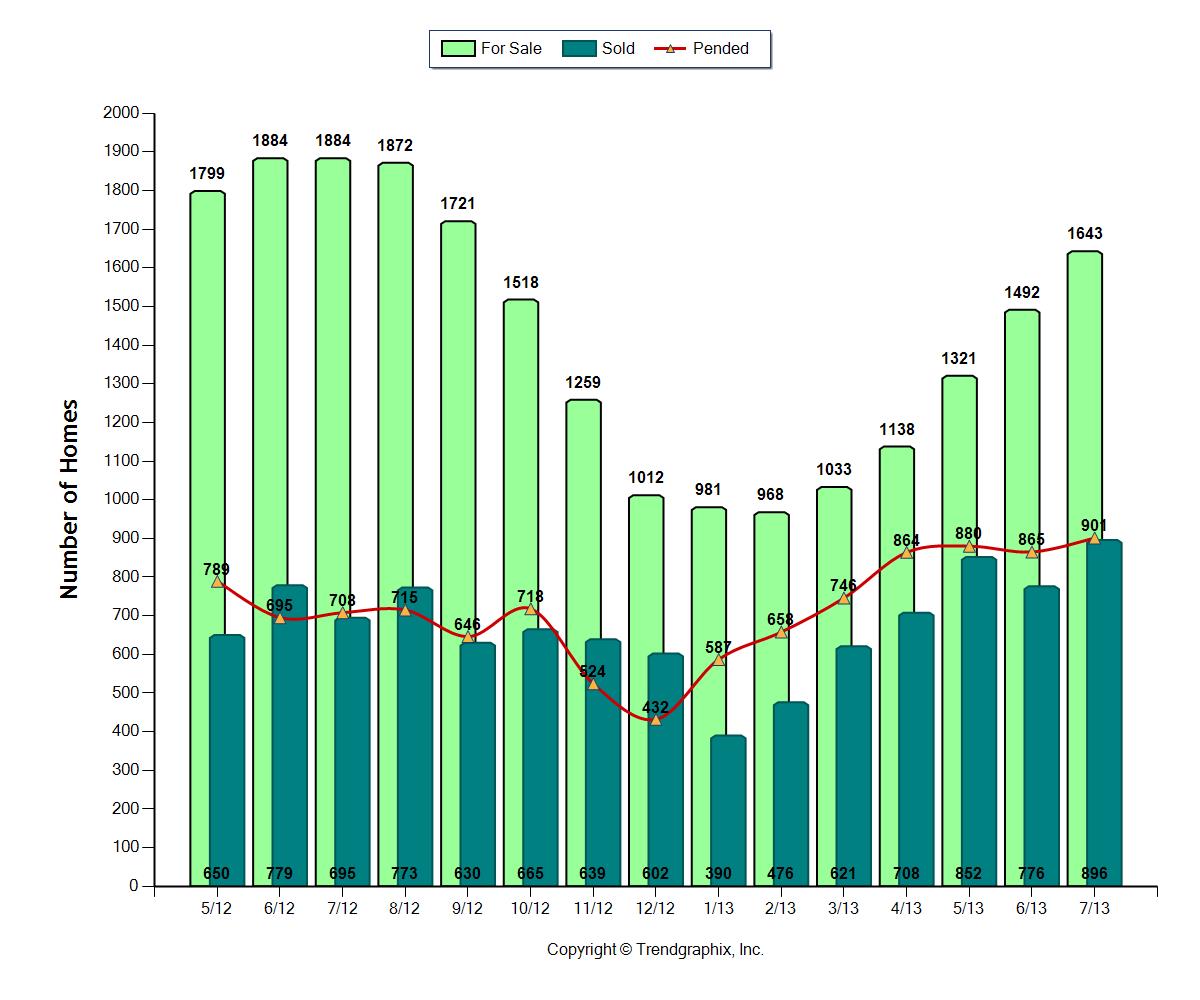
More homes were for sale on Seattle's Eastside in July, the most number of homes we've had for sale so far this year.  The inventory is still below July of 2012, when there were 240+ more homes for sale.  Competition is a little stronger as we see more homes come on the market.  The good news is more homes are actually selling this year than last in most eastside neighborhoods.  As the number of homes for sale has increased, the actual number of sales has also increased. 

There's a very healthy turnover in the homes for sale as 1145 homes came on the market in July.  Pending sales stood at 901 homes, a new high since 2005. This represents a fabulous number of sales. 

I've seen some "for sale" signs up for a little longer than in the spring and there's been an increase in price reductions.  Still, there are some homes that are selling with mulitple offers.  Usually, these homes stand out from the competition with a great price, great condition and great marketing.   

The market is beginning a very slow re-balance between buyers and sellers, as the number of homes for sale increases.  That being said, don't be surprised to see anything and everything happen in this market.  Expect the good homes to sell in a heartbeat, while others take a little longer.  There are some reductions for the sellers who were still unrealistic as to what the market will bear.

Our listings continue to sell quickly and for strong prices.  Through July, all of them sold in less than a week!

The median price for sales was higher in June than July.  This does not mean prices have dropped, it just means the median price for all the homes sold in July happen to be slighty less than the median price for all the homes sold in June.  If we look at the full year, with the exception of July, there's been a steady increase in median pricing. 

As pricing continues to climb, fewer sellers will be underwater and more homes should be coming on the market.

Here are the specifics for July, 2013 as compared to July, 2012:

  • 60.9% of the available homes sold this past July,  37% sold in July, 2012.
  • Homes sold in 28 days, down from 65 days in July, 2012. 
  • In 2012 median pricing in July was $511,000.  In 2013, July's median pricing was $574,000.


If you'd like to know more about the value of your home, please don't hesitate to contact us.

Eastside Real EstateFor BuyersFor SellersMarket StatisticsReal Estate July 11, 2013

Low Inventory, High Sales Numbers, Great Median Price, All in June on Seattle’s Eastside!

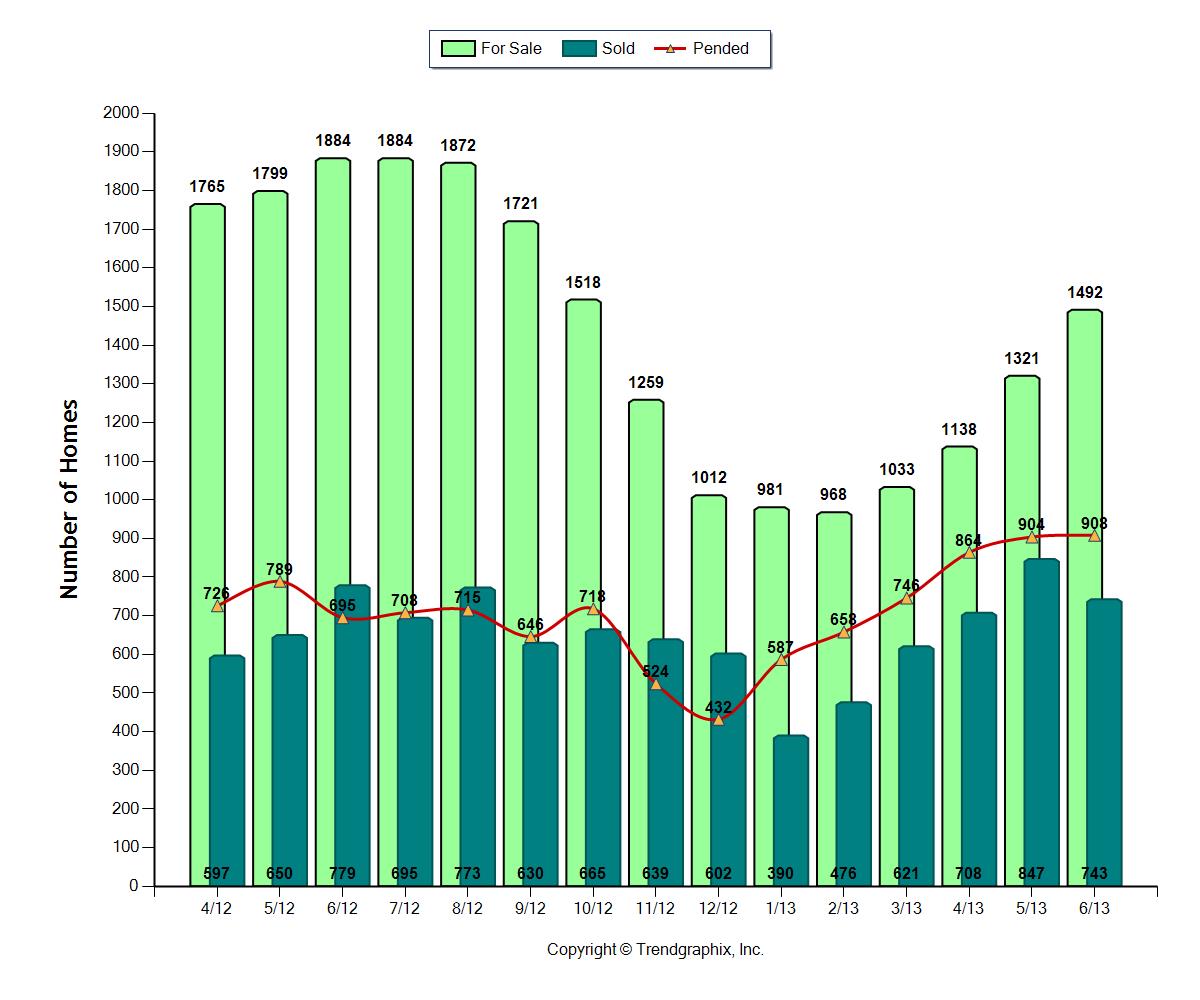
On Seattle's Eastside, we're starting to see the seasonal creep up in listings we see in most summers.  However, we still have far fewer homes on the market than we usually do.  In 2012, there were about 400 more homes for sale than this past June.  Our inventory is so low, that it would've only taken 1.5 months to sell all of the available homes for sale if no other homes had come on the market in June.  The supply is low, considering the number of buyers out there hoping to buy a home. 

Home sales increased in June from May, but at a slower rate than in previous months this year.   The number of sales was not too shabby, though, as 60% of the available homes sold.  A very healthy, brisk rate of home sales, but slower than the 75% that sold in April.   However, pending sales were at the highest they've been since 2005, another significant milestone!

Homes were gone in a flash.  It took only 38 days to sell homes in June!  It was not that long ago that it could take 3 months to get a home sold.  (Think 2011).

The big news is median pricing crossed the threshold to $600,000!  As pricing continues to climb, fewer sellers will be underwater and more homes should be coming on the market.

What a difference a year makes!  Here are the specifics for June, 2013 as compared to June, 2012:

  • 60.9% of the available homes sold this past June,  37% sold in June 2012.
  • Homes sold in 38 days, down from 72 days in June, 2012. 
  • In 2012 median pricing in June was $514,000.  In 2013, June's median pricing was $600,000!

If you'd like to know more about the value of your home, please don't hesitate to contact us. 

Eastside Real EstateFor BuyersFor SellersMarket StatisticsReal Estate June 11, 2013

May Real Estate on Seattle’s Eastside Was Frenzied and Fast Paced

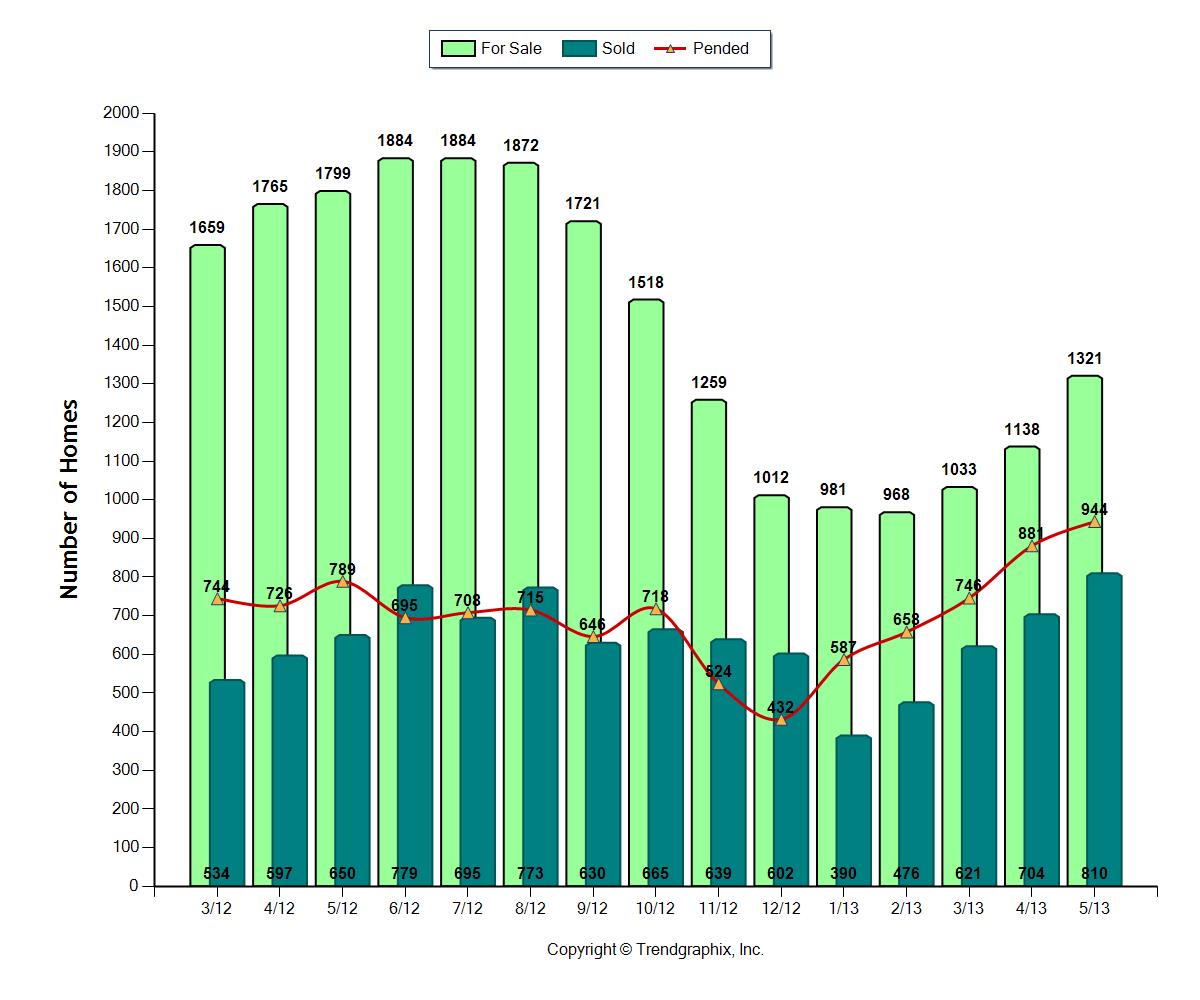
Seattle Eastside real estate continues with its frenzied, fast pace.    Sellers could not ask for anything better than the market we have on the eastside this year.  If no other homes were to come on the market, it would only take two months to sell all the homes that were  for sale in May, when 71% of the available homes sold.  Most homes sold at the asking price, with many selling over full price because of the demand with multiple offers.

As typical of the late spring and early summer, more homes are coming on the market, but the supply is still incredibly low.  We're far below the supply in May, 2012, when there were almost 500 more homes for sale. 

This year, the pace of the sale has kept up with the increase in listings.  The number of sales per month has increased from 587 in January to 944 in May.

What a difference a year makes!  Here are the specifics for May, 2013 as compared to May 2012:

  • 71.5% of the available homes sold this past May,  41% sold in May, 2012.
  • Homes sold in 41 days, down from 74 days in May, 2012. 
  • In 2012 median pricing in May was $500,000.  In 2013, May's median pricing was $565,000. 

If you'd like to know more about the value of your home, please don't hesitate to contact us. 


Eastside Real EstateFor BuyersFor SellersKirklandMarket StatisticsReal EstateWA real estateWindermere Real Estate May 15, 2013

April Showers Brought More Real Estate Sales on Seattle’s Eastside

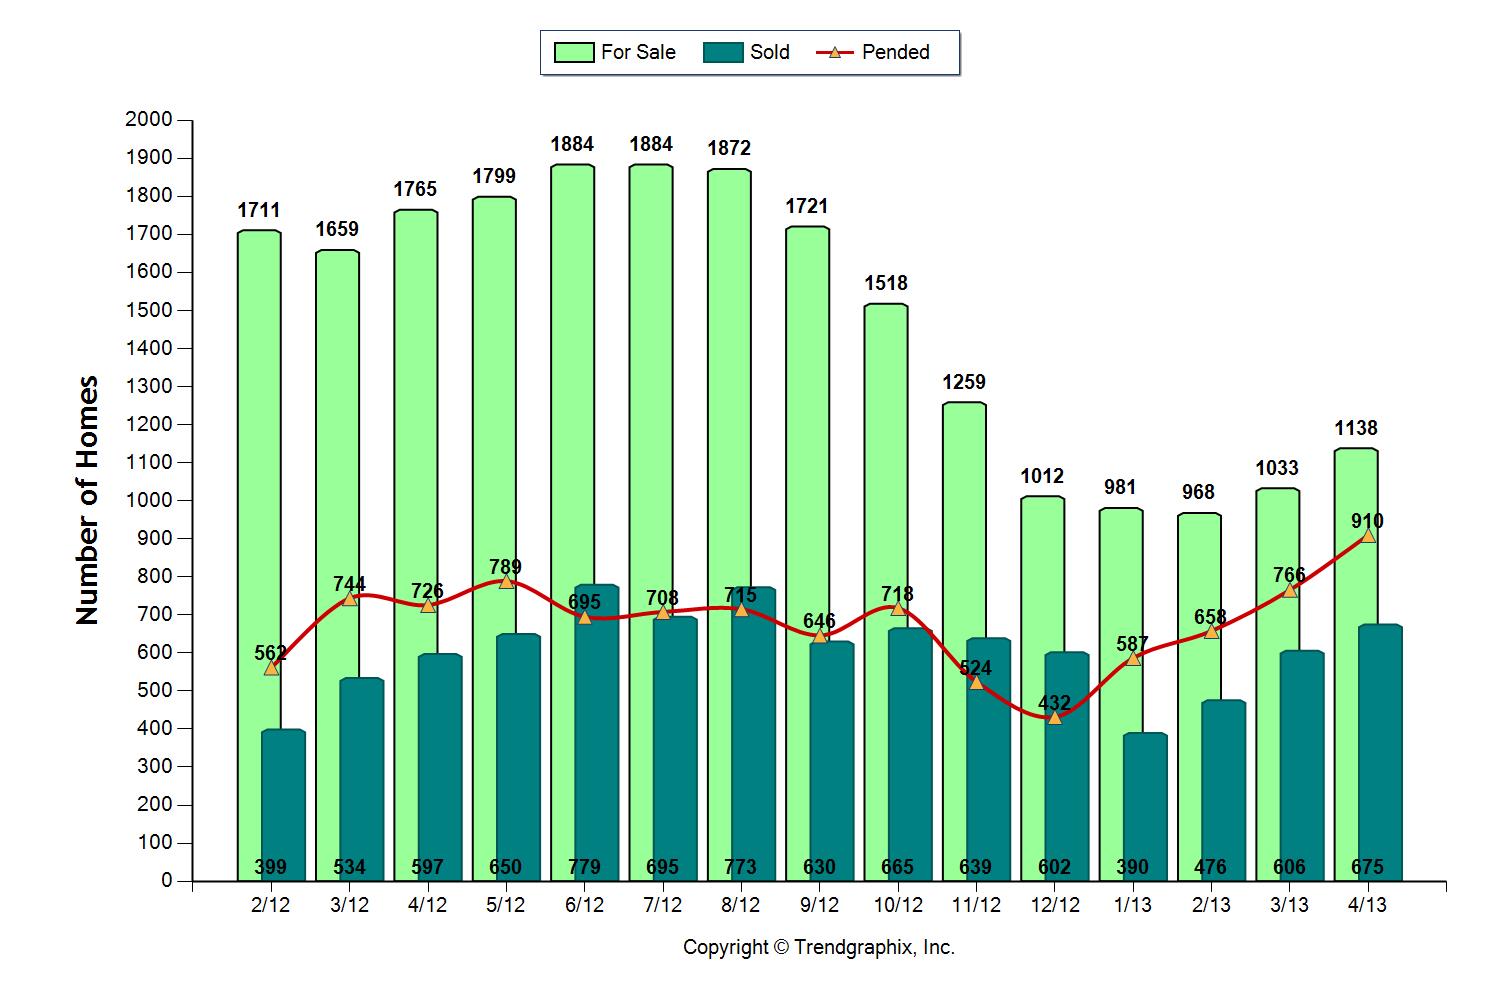
Seattle Eastside real estate sales keep climbing!   Home sales have increased by 35% since January of this year. 

Buyers don't despair.  We're starting to see a significant increase in the number of homes for sale, which is good for buyers.  Sellers still have the advantage in the marketplace, though, because the supply is still low when compared to previous years when 3000-4000 homes were for sale each month on Seattle's Eastside.

Will the market ease up for buyers if more homes come up for sale?  More than likely if the supply increases, the market will still perform well for sellers, but it may not be as frenetic.  It still will be a matter of time before there are any big changes to the marketplace, but it will be interesting to see how the rest of the year plays out.  We believe more homes will come up for sale as typically happens each summer as the school year comes to a close.  Will this change the marketplace dynamics between buyers and sellers?  Probably not much at this point, because we're still on the low side of supply.

Here are the specifics for April, 2013 as compared to April, 2012:

  • 80% of the available homes sold this past April,  41% sold in April, 2012.
  • Homes sold in 48 days, down from 101 days in April, 2012. 
  • In 2012 median pricing in April was $485,000.  In 2013, April's median pricing was $565,000.  Wow, that's a huge jump in median pricing.  We're still expecting median pricing to continue to work its way back up to the higher $500+ range, but much will depend on how many homes come on the market. 

If you'd like to know more about the value of your home, please don't hesitate to contact us. 


Bellevue Real EstateBellevue, WAEastside Real EstateFor BuyersFor HomeownersFor SellersIssaquah Real EstateIssaquah, WAKing County, WAKirklandMarket StatisticsReal EstateRedmondSeattleSeattle real estate April 8, 2013

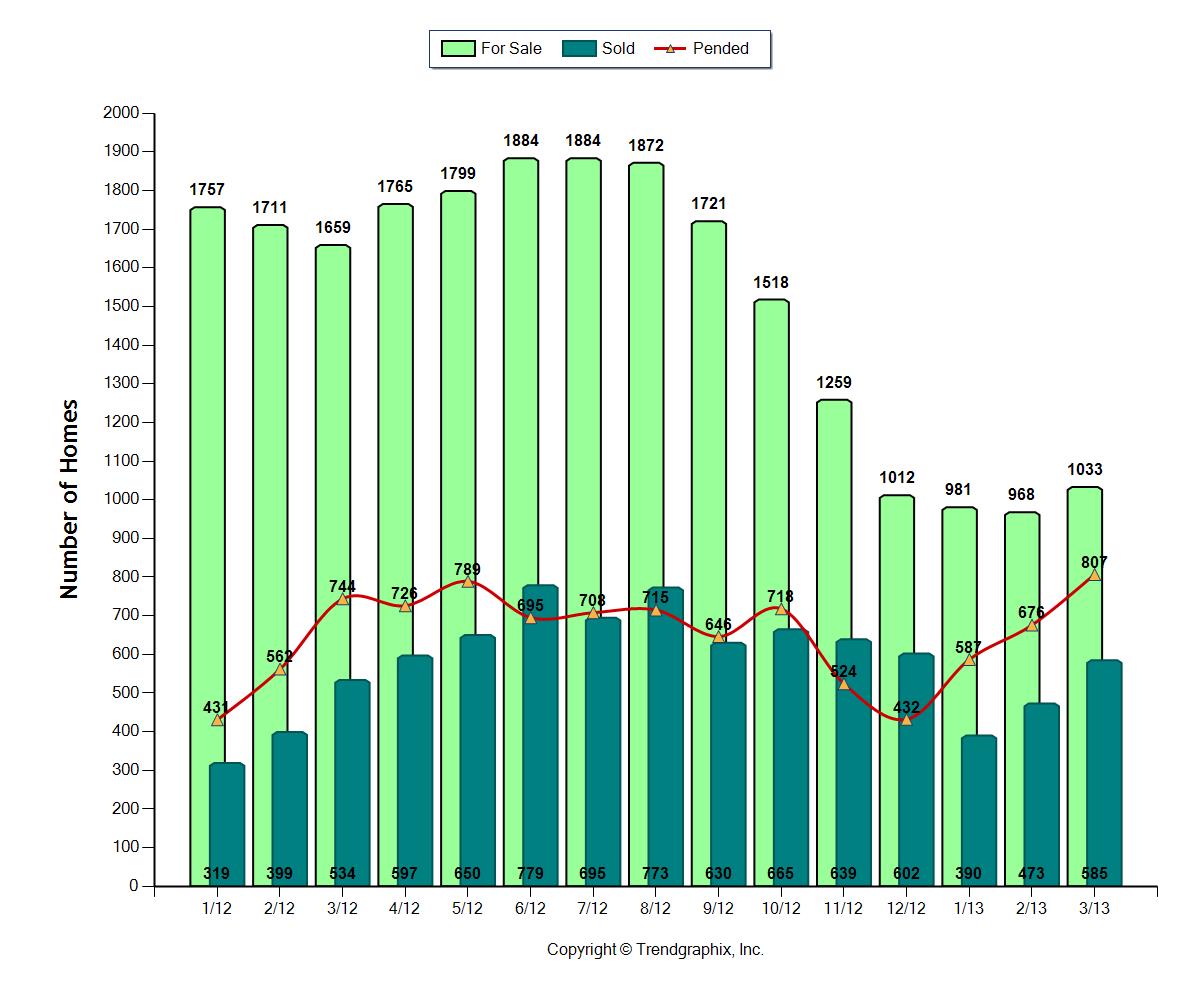
Seattle Eastside March Real Estate Marched On!


Finally, there were a few more homes for sale on Seattle's eastside in March, the first month since August of last year!

Did this increase in inventory dampen the number of sales?  So far, nothing has slowed down the rate of sales.  In fact, the rate of home sales in Bellevue, Kirkland, Redmond, and other eastside cities was higher in March than February.   Seventy-eight percent of the homes on the market sold!  There is still more than one buyer for each home, so multiple offers remain the norm.

It's been hopping out there in the real estate market on the eastside.  We're starting to see some Eastside buyers behave like Seattle buyers.  This past weekend, a buyer pre-inspected one of our listings before making an offer.  Rumor had it that there were going to be at least 4 offers on the table and this particular buyer wanted to come to that table with a very clean, straightforward offer.  Buyers in Seattle have pre-inspected homes for years when the market has been hot.  It's not something we've seen as much on the eastside, but we wouldn't be surprised if it continues. 

Here are the specifics for March, 2013 as compared to March, 2012:

  • 78% of the available homes sold this past March,  44% sold in March, 2012.
  • Homes sold in 62 days, down from 109 days in March, 2012. 
  • In 2012 median pricing in March was $470,000.  In 2013, March's median pricing was $560,000.  We're expecting median pricing to continue to work its way back up to the higher $500+ range, particularly since inventory is still so low.

The Seattle Times reported  a 17% increase in pricing from March, 2012 on the eastside.

       It was the biggest monthly percentage gain since April 2012, when King County’s median home price started rising after 19 months of decline.

If you'd like more information specific to your home, don't hesitate to contact us.

Eastside Real EstateFor BuyersFor SellersMarket StatisticsReal Estate March 18, 2013

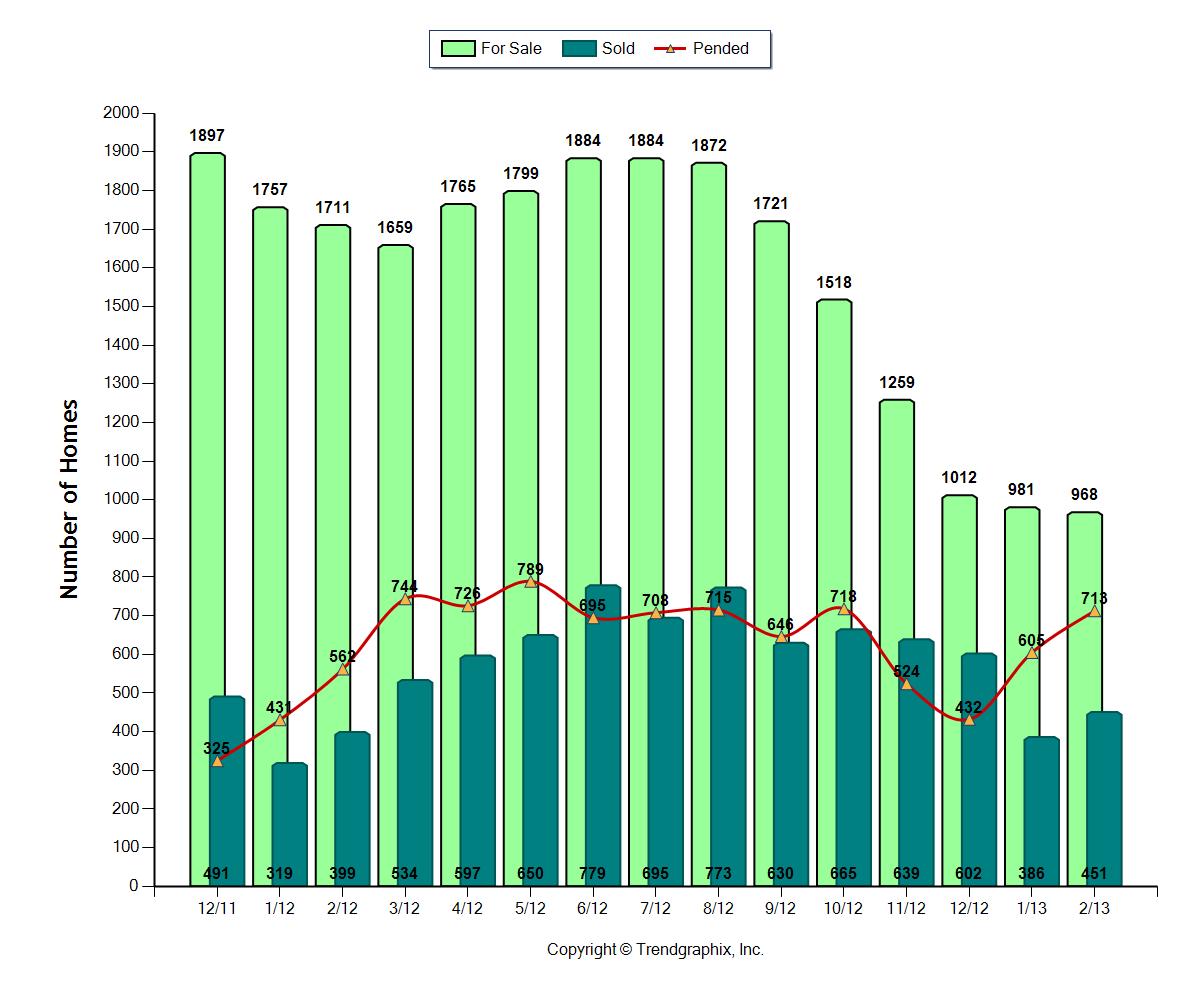
If You Had a “For Sale” Sign in Your Yard in February on Seattle’s Eastside You Probably Sold Your Home!

Did February's real estate sales top January?  They sure did! Seventy-four percent of the homes on the market sold!  Homes continue to sell with multiple offers and for over full price.

The number of homes dropped only a bit from January, and was the lowest number of homes for sale in over 20 years.  Sales skyrocketed though, climbing from 605 to 713 homes.  This number doesn't sound like a lot, until you consider the fact that only 968 homes were for sale. 

The hot market continues, but two areas of Seattle's eastside were on fire.  South Bellevue and Issaquah and East Bellevue and Redmond, near Microsoft.  If a home had a "for sale" sign in the yard in these areas, it sold last month! 

Sellers still need to price their homes for the market or the buyers will not come.  Buyers will pay more than full price if there's competition from other buyers and the house is a well maintained with a market value price tag on it.  Homes don't sell for more than full price if they are overpriced when they go on the market.  But if buyers see the value of the home and there's more than one buyer, that's when a home sells for more than full price.  Sellers must attract the buyers with a good value if they truly expect to attract multiple buyers and sell for at least full price and possibly more!

Buyers, since the ball is in the seller's court in 2013, you have to be prepared. Work with a Realtor who knows market value and whether it's worth paying more for a home if there are multiple offers.  Find out if your Realtor has worked in this kind of seller's market before and how they handle multiple offers.  Get pre-approved by your lender and have it in writing to present with your offer.  Make a simple, clean offer.  Include a good earnest money check to accompany the offer.  Pre-inspect the house if the seller allows it, so you can be assured of an inspection, but not have it be part of the offer. It's one less contingency that you and the seller will have to sort out when comparing the offers and puts your in a better position.

The hottest selling price range was for homes priced under $350,000.  Right behind it were the homes priced between $500-750,000.  Fifty three homes sold for over $1,000,000 this past month.  There's less than 2 months worth of inventory for all homes priced below $750,000!

The strong real estate market should continue.   In the Seattle Times, Dick Conway, an economic forecaster said:

…. robust job creation by the likes of Boeing, Amazon and other major companies headquartered here should create more demand for new housing, which in turn will create construction jobs, and hunger for more housing.

Here are the specifics for February, 2013 as compared to February, 2012:

  • 74% of the available homes sold this past February,  33% sold in February, 2012.
  • Homes continued to sell quickly, in 79 days, which is down from 119 days in February, 2012. 
  • In 2012 median pricing in February was $447,000.  In 2013, February's median pricing was $525,000.  Median pricing has been a solid $500,000+ for months now and should continue to be for the next few months


If you'd like more information specific to your home, don't hesitate to contact us.

*The absorption rate is the percentage calculated by dividing the number of sales by the number of homes for sale.

2009 stimulus package2010 Home buyer Tax CreditBellevue Real EstateFor BuyersFor SellersIssaquah Real EstateKing County Real EstateKirklandMarket StatisticsReal EstateSammamish, WA Real EstateSeattle real estateWA real estateWindermere Real EstateWoodinville, WA Real Estate January 13, 2010

2009 Ends With a More Balanced Real Estate Market Around Seattle

King-Snohomish County Real Estate December, 2009

December, 2009 Seattle real estate finished the year off on a more positive note.  With so much of the Seattle area real estate market showing “yellow,”  there was a solid return to a real estate market more evenly balanced between buyers and sellers.  This is more like the real estate market we saw in the 1990’s.

There was still a significant increase in real estate sales from December, 2008, with West Bellevue leading the way on Seattle’s eastside.  The number of West Bellevue home sales shot up by 279%!  Because home prices in West Bellevue tend to be among the most expensive on Seattle’s eastside and in the Seattle area in general, this signaled more of return to confidence in the real estate market.  Prices for high end homes have dropped to the point that buyers were more comfortable buying.  Since most of these sales had nothing to do with the first time home buyer credit, this signaled a strong change in buyer confidence and willingness to buy.

Prices tended to be more reasonable all over the Seattle area. Lower prices, low interest rates, and the first time home buyers’ tax credit did a lot to open up the real estate market.

The year ended with the lowest number of homes on the market for all of 2009.  The amount of properties for sale was similar to what was available in 2007.  This does not mean the market will return to 2007 real estate activity, but it is a good thing to see that there were, and are, less properties for sale in the Seattle area.

What’s in store for 2010?

I expect the extension and expansion of the 2010 home buyer credit to continue to spur real estate sales on. I also expect it to bring more home sellers into the market, so competition could increase again.  The number of properties for sale is a huge factor in pricing and market time.  The first part of 2010 should be pretty active for both home buyers and sellers.  After April 30th when the home buyer tax credit goes away, much will depend on how many homes are on the market and the interest rates.

As I’ve mentioned before, be prepared for any and everything with real estate sales in the coming months. There’s no “one size fits all.”  Home sales will depend on the price point, location, the home’s condition, the competition, and/or a combination of these things. Some homes will sell quickly and for a good price, others will still undergo significant price reductions to meet market expectations, and others will sell, but for less than one would expect.  This, actually, is what we expect to see in a normal, more balanced real estate market.

What do the numbers on the map mean?

The map is divided into the numbered areas as defined by our Northwest Multiple Listing Service (NWMLS).  Downtown Bellevue is area 520 and East Bellevue is area 530, as an example.

What do the colors mean?

Red means it’s a sellers’ market, a sellers’ advantage.

Yellow means a balanced market between buyers and sellers.

Green means its a buyers’ market.

If you take each area as shown on the map and look to the area number on the side of the map, it will tell you how long it would take to sell every home currently for sale if no other home came up on the market in that area.