
 Facebook
 X
X
 Pinterest
 Copy Link
There Are Some "Hot" Real Estate Markets Around Seattle
There are some hot real estate markets in the Seattle area. These “red” hot areas are shown below. The usual suspects of Queen Anne and Capital Hill experienced a hot market in February. The newest suspect, East Bellevue and Redmond near Microsoft, my neck of the Seattle real estate market, was also going strong. In that area, 35% of the available homes sold last month, the best odds on the eastside. It’s exciting to see, since it’s been years since we’ve had “red” or a seller’s market on the eastside.*
I keep hearing about homes selling quickly and with multiple offers in a variety of price ranges. Since most of the eastside is a balanced real estate market,** this only happens for the best homes. It happens for the “red” hot homes with hot prices and in beautiful condition. There are number of other homes that take a while to sell, often with price reductions before getting the offer.
Hotter King & Snohomish County real estate markets 2-28-11

———————————
What do the colors mean?
*Red means it’s a sellers’ market, a sellers’ advantage. Homes take less than 3 months to sell.
**Yellow means a balanced market between buyers and sellers. Homes on the average take 3-6 months to sell.
Green means it’s a buyers’ market. Homes take longer than 6 months to sell.
If you take each area as shown on the map and look to the area number on the side of the map, it will tell you how long it would take to sell every home currently for sale if no other home came up on the market in that area.
What do the 3 digit numbers on the map mean?
The map is divided into the numbered areas as defined by our Northwest Multiple Listing Service (NWMLS). Downtown Bellevue is area 520 and East Bellevue is area 530, as an example.
Can you see from the map how the real estate was doing in your city did last month? If you’d like more specific information for your neighborhood, please feel free to contact me.
Is This The New "Normal" for Seattle Area Real Estate?
Maybe this is how real estate is going to be in the Seattle area. Maybe we’ll have some local markets where things are “hot” just for the buyer, and, someday again, even for the seller. But maybe the Seattle marketplace will be more balanced (yellow on the map below) between the buyers and the sellers. Maybe this is the new “normal” real estate market. The majority of homes will sell in 3-6 months, some will sell for full price, some homes will sell with a small price reduction, and some will even have multiple offers. Still others will undergo a number of price reductions before selling and some will not even get an offer.
Here’s what I wrote in my November post on the real estate market. I shared similar thoughts then, so I’m wondering if we’re starting to see a pattern here.
Does this mean it’s no longer a challenge to sell a home? Absolutely not. The competition is still very stiff. There are a lot of homes for buyers to buy. A market in which it takes homes 3-6 months to sell is still a challenging, but not a terrible, real estate market. In a balanced market, some homes sell quickly for a good price, others take a lot longer to sell with a steep discount in the the asking price, and still others don’t sell at all. I’m still going to be telling home sellers to have the best home out there and expect a sale to take a long time to happen. Homes that sell have to be a really good value to be the ones that sell. Believe it or not, this is pretty typical of a more balanced, realistic market. A realistic market is not a fast paced real estate market. A realistic market will have some distressed home sellers. Although this is a cause of major concern and I am not minimizing the situation for those who are distressed sellers, the majority of eastside homes are NOT distressed sales.
So maybe this is the new “normal”? What do you think?

The State Of Seattle Area Real Estate in December, 2010

- Seattle Area Real Estate 11-30-10
———————————
What do the 3 digit numbers on the map mean?
The map is divided into the numbered areas as defined by our Northwest Multiple Listing Service (NWMLS). Downtown Bellevue is area 520 and East Bellevue is area 530, as an example.
What do the colors mean?
Red means it’s a sellers’ market, a sellers’ advantage. Homes take less than 3 months to sell.
Yellow means a balanced market between buyers and sellers. Homes on the average take 3-6 months to sell.
Green means it’s a buyers’ market. Homes take longer than 6 months to sell.
If you take each area as shown on the map and look to the area number on the side of the map, it will tell you how long it would take to sell every home currently for sale if no other home came up on the market in that area.
This Past Month Seattle Eastside Real Estate Was Balanced Between Buyers and Sellers

Seattle Area Real Estate 11-30-10
The Seattle-eastside market is balanced. Surprised by that? Here’s why I say this: A balanced market is when homes on average are selling in 3-6 months. This means there was a more level playing field between buyers and sellers during that particular month, in this case November 2010. Given the news we hear, it’s surprising to think of the eastside real estate market in this way.
Does this mean it’s no longer a challenge to sell a home? Absolutely not. The competition is still very stiff. There are a lot of homes for buyers to buy. A market in which it takes homes 3-6 months to sell is still a challenging, but not a terrible, real estate market. In a balanced market, some homes sell quickly for a good price, others take a lot longer to sell with a steep discount in the the asking price, and still others don’t sell at all. I’m still going to be telling home sellers to have the best home out there and expect a sale to take a long time to happen. Homes that sell have to be a really good value to be the ones that sell. Believe it or not, this is pretty typical of a more balanced, realistic market. A realistic market is not a fast paced real estate market. A realistic market will have some distressed home sellers. Although this is a cause of major concern and I am not minimizing the situation for those who are distressed sellers, the majority of eastside homes are NOT distressed sales.
———————————
What do the 3 digit numbers on the map mean?
The map is divided into the numbered areas as defined by our Northwest Multiple Listing Service (NWMLS). Downtown Bellevue is area 520 and East Bellevue is area 530, as an example.
What do the colors mean?
Red means it’s a sellers’ market, a sellers’ advantage. Homes take less than 3 months to sell.
Yellow means a balanced market between buyers and sellers. Homes on the average take 3-6 months to sell.
Green means it’s a buyers’ market. Homes take longer than 6 months to sell.
If you take each area as shown on the map and look to the area number on the side of the map, it will tell you how long it would take to sell every home currently for sale if no other home came up on the market in that area.
There's No Sign of a Seller's Market in Seattle Real Estate

Seattle Area Real Estate Map Showing Different Market Performance 10-31-10
The lack of “red” showing a seller’s market in Seattle area real estate is no big surprise. However, it’s good to see the market was more balanced in some Seattle area neighborhoods in October.
A balanced market is when homes on average are selling between 3-6 months, which means there was a level playing field between buyers and sellers in those areas for that particular month. A buyer’s market means the homes on average are taking longer than 6 months to sell and a seller’s market means the homes take less than 3 months to sell.
A real estate market is labeled a buyer or seller’s market depending on how long it took the homes to sell that month. Since the sales can vary each month, the type of real estate market can very easily change, going back and forth between a buyer or seller advantage.
Even though it’s more challenging for sellers, there are homes that stand out and sell with multiple offers or for full price. Look at the overall real estate market, look at the market in the neighborhood, and then look at the specific home and how well it’s priced for that market. When making a pricing decision, all of this data is important.
———————————
What do the numbers on the map mean?
The map is divided into the numbered areas as defined by our Northwest Multiple Listing Service (NWMLS). Downtown Bellevue is area 520 and East Bellevue is area 530, as an example.
What do the colors mean?
Red means it’s a sellers’ market, a sellers’ advantage. Homes take less than 3 months to sell.
Yellow means a balanced market between buyers and sellers. Homes on the average take 3-6 months to sell.
Green means it’s a buyers’ market. Homes take longer than 6 months to sell.
If you take each area as shown on the map and look to the area number on the side of the map, it will tell you how long it would take to sell every home currently for sale if no other home came up on the market in that area.
It Was Mostly a Buyers' Market on Seattle's Eastside in September, 2010

King & Snohomish County Reat Estate, 9-30-10
Sellers’ markets on this map are in red and there is no red in Seattle or on Seattle’s eastside. Most of the neighborhoods are buyers’ markets, which are in green. Only two areas, Bellevue and Redmond near Microsoft, which is area 530, and area 600, which is Woodinville, Bothell, Duvall, are balanced markets. Last month, Bellevue and Redmond near Microsoft and Kirkland were the balanced markets.
A balanced market is when homes on average are selling between 3-6 months, which means there was a level playing field between buyers and sellers in those areas for that particular month. A buyers’ market means the homes on average are taking longer than 6 months to sell and a sellers’ market means the homes take less than 3 months to sell.
A real estate market is labeled a buyer or sellers’ market depending on the homes that actually sold that particular month. Since the sales can vary each month, the type of real estate market can very easily change, going back and forth between a buyer or seller advantage. Don’t count on the market staying the same each month in any area.
Remember, too, an area may be a buyers’ market and there can still be a terrific home that’s the best of the competition and sells with multiple offers or for full price. It’s always important to understand how much competition a particular home has and how well priced it is when compared to the competition. So look at the overall real estate market, look at the market in your neighborhood, and then look at the specific home and how well it’s priced for that market. Weigh all of this information when making a buying decision or a decision as to how to price your home.
What do the numbers on the map mean?
The map is divided into the numbered areas as defined by our Northwest Multiple Listing Service (NWMLS). Downtown Bellevue is area 520 and East Bellevue is area 530, as an example.
What do the colors mean?
Red means it’s a sellers’ market, a sellers’ advantage.
Yellow means a balanced market between buyers and sellers.
Green means it’s a buyers’ market.
If you take each area as shown on the map and look to the area number on the side of the map, it will tell you how long it would take to sell every home currently for sale if no other home came up on the market in that area.
Seattle-Eastside Real Estate is Mostly Green, A Buyers' Market

- King & Snohomish County Real Estate Activity 8-31-10
The Seattle-eastside has flipped back almost completely to a buyers’ market. Two areas, Redmond and East Bellevue near Microsoft and Kirkland, were more balanced real estate markets, with the market time to sell a home falling between 3 to 6 months. If you check out what the colors represent below, you can see how much of King County real estate is in the buyers’ camp right now. With today’s low interest rates and the ability to negotiate strongly because of this market trend, it’s probably a better time to buy a home now than when everyone was rushing to beat the expiration of the tax credit. The savings would be spread out over a longer time period, but would be worth far more than the one time $8000 tax credit. If you do decide to buy, remember to look for a home you can grow in that’s close to transportation, shopping, schools, and jobs. A home that meets these criteria will hold its value better.
What do the numbers on the map mean?
The map is divided into the numbered areas as defined by our Northwest Multiple Listing Service (NWMLS). Downtown Bellevue is area 520 and East Bellevue is area 530, as an example.
What do the colors mean?
Red means it’s a sellers’ market, a sellers’ advantage.
Yellow means a balanced market between buyers and sellers.
Green means it’s a buyers’ market.
If you take each area as shown on the map and look to the area number on the side of the map, it will tell you how long it would take to sell every home currently for sale if no other home came up on the market in that area.
There Were No Sellers Markets in the Seattle Area in July, 2010

King & Snohomish County Real Estate, 7-31-10
There were no sellers’ market in July. “Red” indicates a sellers’ market with homes selling in less than 3 months. If you look at the map above, all the Seattle markets are either a buyer’s market or a balanced market between buyers and sellers.
There’s a mix on Seattle’s eastside. Some markets are buyers’ markets such as West Bellevue and the Sammamish plateau cities of Sammamish, North Bend, Preston, and Fall City. Homes in these real estate markets took on average over 6 months to sell. The majority of Seattle Eastside real estate was a balanced market with homes selling between 3-6 months.
The state of the real estate market is a huge contrast from just three months ago when there was no “green” on the map at all.

- King Snohomish Counties Real Estate Market 4-30-10
Clearly, the tax credit did its magic during that time. Is it the economy, job situation or is it the lack of urgency with interest rates slated to be low for a long time that is keeping buyers from making a home purchase? I’ve heard opinions about all three reasons as the cause for the slow moving real estate market. What do you think?
__________________________________________________________________________________
What do the numbers on the map mean?
The map is divided into the numbered areas as defined by our Northwest Multiple Listing Service (NWMLS). Downtown Bellevue is area 520 and East Bellevue is area 530, as an example.
What do the colors mean?
Red means it’s a sellers’ market, a sellers’ advantage.
Yellow means a balanced market between buyers and sellers.
Green means it’s a buyers’ market.
If you take each area as shown on the map and look to the area number on the side of the map, it will tell you how long it would take to sell every home currently for sale if no other home came up on the market in that area.
"Green" is Back on the Seattle-Eastside's Real Estate Map, May, 2010

Home Sales Activity for King and Snohomish Counties, May, 2010
During May “green” crept back into a number of Seattle areas. One large area on the eastside, Woodinville, Bothell, Kenmore, Duvall, and north Kirkland was “green,” back as a buyer’s market.
April was the first month in a very long time in which there was no ” green,” no buyers’ markets in almost all the Seattle-eastside areas. In April, the Seattle area real estate market was the strongest in years. This is most likely a direct result of the 2010 tax credit. Both buyers and sellers were rushing to buy and sell before the expiration of the credit.
May represented a lull in the Seattle real estate market. Was this a temporary lull or our new normal? The next several months will be good indicators, although summer tends to be a slower time every year in Seattle real estate. Home buyers and sellers are like everyone else. Seattleites play outside in summer. Of course, that’s providing the sun ever comes out this year!
The good real estate news is there are still great homes and condos out there to buy and interest rates are at historic lows. The loss of the tax credit may not make much of a difference when calculating the savings in monthly payments over time.

Interest Rates 6-2010
It may be the fall before we can determine the true pace of Seattle real estate. I’ll keep you posted.
- King Snohomish Counties Real Estate Market 4-30-10
What do the numbers on the map mean?
The map is divided into the numbered areas as defined by our Northwest Multiple Listing Service (NWMLS). Downtown Bellevue is area 520 and East Bellevue is area 530, as an example.
What do the colors mean?
Red means it’s a sellers’ market, a sellers’ advantage.
Yellow means a balanced market between buyers and sellers.
Green means it’s a buyers’ market.
If you take each area as shown on the map and look to the area number on the side of the map, it will tell you how long it would take to sell every home currently for sale if no other home came up on the market in that area.
There's No Green on The Seattle-Eastside Real Estate Map April, 2010
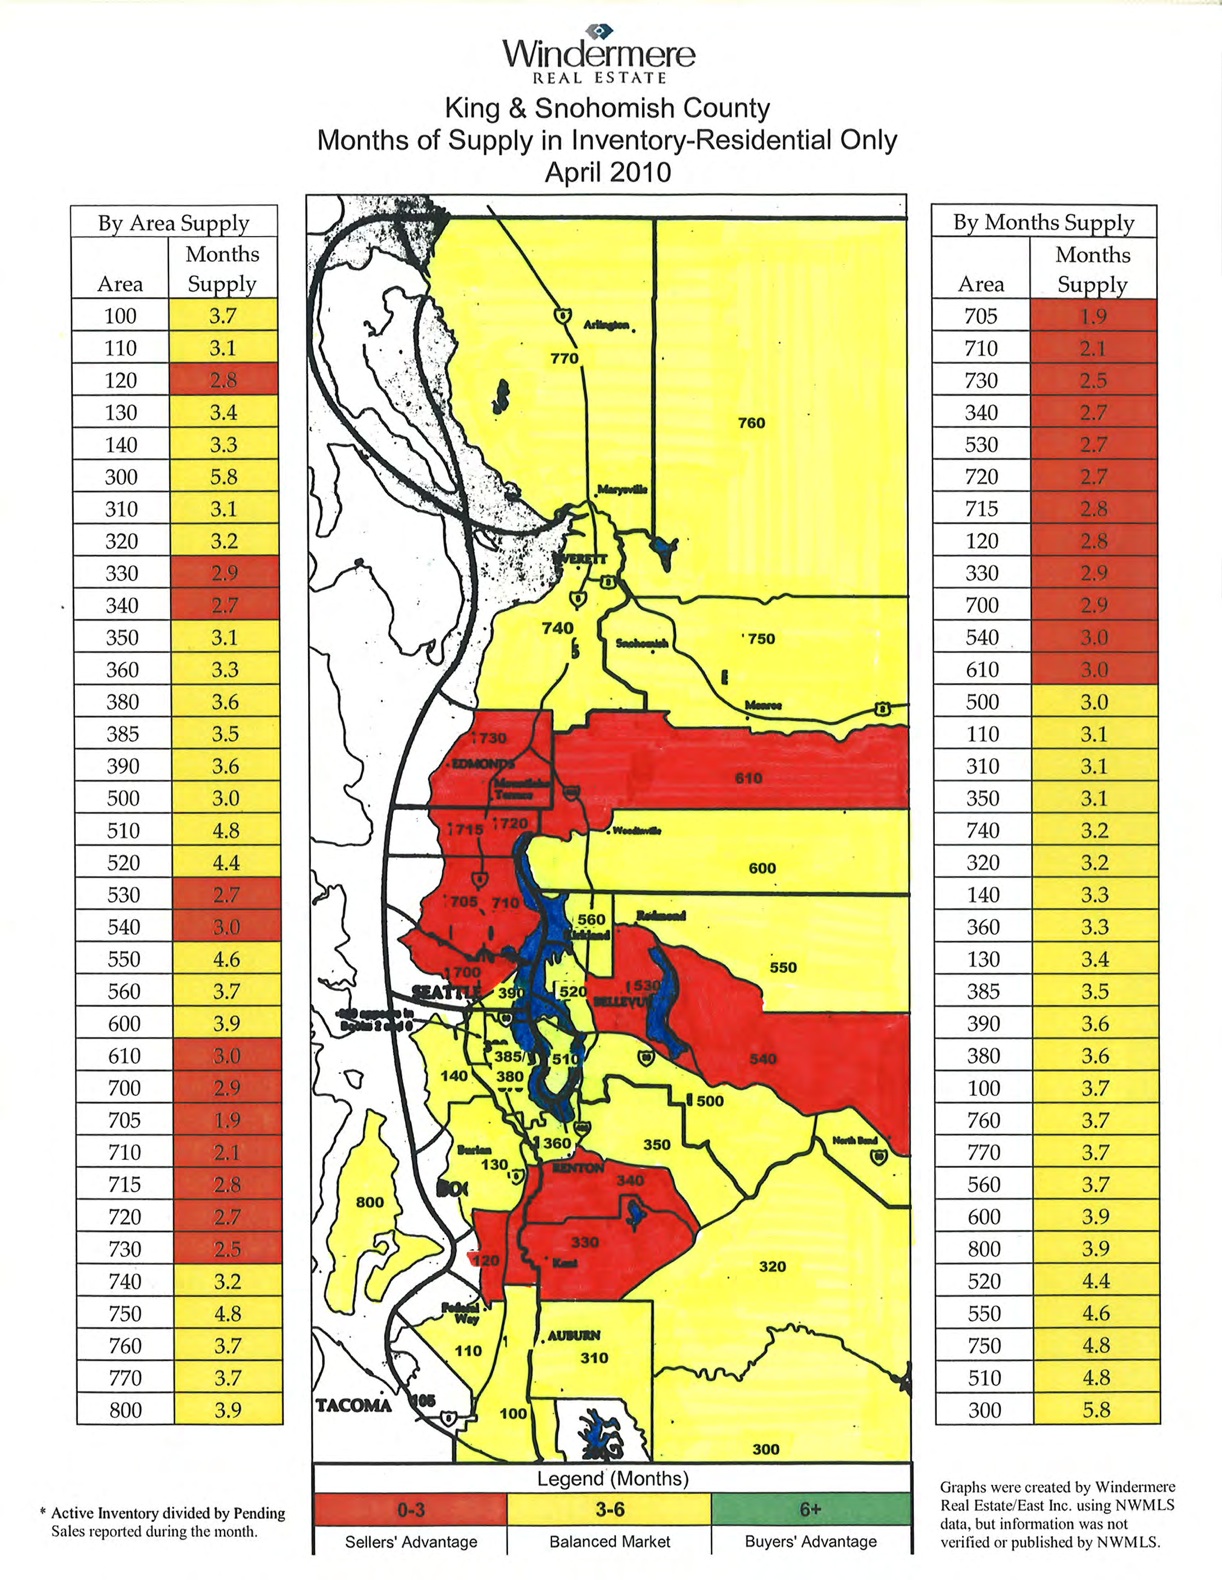
King Snohomish Counties Real Estate Market 4-30-10
What do the numbers on the map mean?
The map is divided into the numbered areas as defined by our Northwest Multiple Listing Service (NWMLS). Downtown Bellevue is area 520 and East Bellevue is area 530, as an example.
What do the colors mean?
Red means it’s a sellers’ market, a sellers’ advantage.
Yellow means a balanced market between buyers and sellers.
Green means it’s a buyers’ market.
If you take each area as shown on the map and look to the area number on the side of the map, it will tell you how long it would take to sell every home currently for sale if no other home came up on the market in that area.
The first time in years, literally, that there were no buyers’ markets on the King-Snohomish County, Washington map of real estate. Last month, there was one area, Vashon Island, which is now coming up as a balanced market.
The two hottest selling markets on the eastside in April, 2010?
The first is Redmond, near Microsoft, East Bellevue and the second is the plateau area which includes Sammamish, parts of Issaquah, North Bend, and Fall City.
Seattle-Eastside Real Estate is Beginning to Turn Red
Seattle-eastside real estate is starting to see “red.” Red is a sellers’ market, which means the average market time to sell a Seattle eastside home in the areas marked in red is from 3-6 months.
I sell a lot homes in the “hottest Seattle eastside area, which we call area 530, East Bellevue and the Redmond neighborhoods around Microsoft. Homes sales were hopping this past month, with sales often happening in two weeks or less. If you live in any of the areas marked in “red” and your home is not selling, it’s priced too high compared to competition. If your home is overpriced, you’re helping to sell other homes and they’re selling at your expense.
Seattle proper remains the “hottest” area overall, but if you’re looking to buy on the eastside, all the areas are either a real estate market that’s balanced between buyer and seller (yellow) or in “red,” a sellers’ market.
Buyers markets were absent in March. There’s no green (for a buyers market) left on this map, with the exception of Vashon Island, so the buyers’ markets we’ve been experiencing over the last few years were no where to be seen in in March.
Will the map show the same colors next month? I believe April will also be a very strong month for Seattle-eastside real estate.

Which King/Snohomish County Areas Are Selling Faster?
What do the numbers on the map mean?
The map is divided into the numbered areas as defined by our Northwest Multiple Listing Service (NWMLS). Downtown Bellevue is area 520 and East Bellevue is area 530, as an example.
What do the colors mean?
Red means it’s a sellers’ market, a sellers’ advantage.
Yellow means a balanced market between buyers and sellers.
Green means it’s a buyers’ market.
If you take each area as shown on the map and look to the area number on the side of the map, it will tell you how long it would take to sell every home currently for sale if no other home came up on the market in that area.
