
 Facebook
 X
X
 Pinterest
 Copy Link
How Did August, 2010 Seattle-Eastside Real Estate Sales Stack Up In Your Neighborhood?
[googlemaps http://maps.google.com/maps?source=s_q&hl=en&geocode=&q=Seattle-eastside&sll=47.709762,-122.011414&sspn=0.310487,0.911865&ie=UTF8&split=1&radius=21.22&rq=1&ev=zo&hq=Seattle-eastside&hnear=&ll=47.709762,-122.011414&spn=0.310487,0.911865&t=h&output=embed&w=425&h=350]
How did August, 2009 stack up to August, 2010 in your neighborhood?
(Click on the cities below to see real estate trends for the past 5 years. You’ll find the median pricing for each city and whether the number of homes for sale and the number of sales went up or down. The odds of selling a home in each area is a result of the number of homes for sale divided by the actual number of home sales.)
The plateau: Sammamish, Issaquah, North Bend, and Fall City
The odds of selling a home were 16%.
Median sales price decreased from $515,000 $479,895.
The number of homes for sale increased by 9% and sales were down by 17% from last year.
The odds of selling a home were 21%.
Median sales price increased to $494,900 from $475,000.
The number of homes for sale were up by 4% and sales were UP by 8%.
The odds of selling a home were 14%.
Median price increased to $550,000 from $499,500.
The number of homes for sale dropped by 13% and sales were down by 26%.
Woodinville/Bothell/Kenmore/Duvall/North Kirkland
The odds of selling a home were 13%.
Median price was down from $425,000 to $415,000.
The number of homes for sale declined by 2% and sales were down by 27%.
The odds of selling a home were 14%.
Median price increased to $641,000 from $581,919.
The number of homes for sale declined by 13% and sales were down by 27%.
The odds of selling a home were 6%.
Median pricing was down from $899,475 to $869,000.
The number of homes for sale decreased by 16% and sales decreased by 65%. (Ouch!)
Redmond/Education Hill/ Carnation
The odds of selling a home were 15%
Median pricing increased from $542,250 to $549,950.
The number of homes for sale increased by 12% and sales decreased by 10%.
Real estate sales numbers are down on Seattle’s eastside, with the exception of one area. The East Bellevue and Redmond area near Microsoft showed a slight increase in the number of homes sold. This area was also the only area to show an increase in median price, number of homes on the market (not so good), and number of homes sold. However, median pricing was up in 3 other areas, South Bellevue and Issaquah, Kirkland, and Redmond and Carnation.
The number of homes for sale on Seattle’s eastside is the highest for this year, but should be experiencing a downward swing as we head into fall. Right now, though, there are a lot of choices out there and not as many buyers to compete with. Good buys are out there if you take your time and check out the homes for sale.
What real estate activity have you seen in your neighborhood?
Seattle-Eastside Real Estate is Mostly Green, A Buyers' Market

- King & Snohomish County Real Estate Activity 8-31-10
The Seattle-eastside has flipped back almost completely to a buyers’ market. Two areas, Redmond and East Bellevue near Microsoft and Kirkland, were more balanced real estate markets, with the market time to sell a home falling between 3 to 6 months. If you check out what the colors represent below, you can see how much of King County real estate is in the buyers’ camp right now. With today’s low interest rates and the ability to negotiate strongly because of this market trend, it’s probably a better time to buy a home now than when everyone was rushing to beat the expiration of the tax credit. The savings would be spread out over a longer time period, but would be worth far more than the one time $8000 tax credit. If you do decide to buy, remember to look for a home you can grow in that’s close to transportation, shopping, schools, and jobs. A home that meets these criteria will hold its value better.
What do the numbers on the map mean?
The map is divided into the numbered areas as defined by our Northwest Multiple Listing Service (NWMLS). Downtown Bellevue is area 520 and East Bellevue is area 530, as an example.
What do the colors mean?
Red means it’s a sellers’ market, a sellers’ advantage.
Yellow means a balanced market between buyers and sellers.
Green means it’s a buyers’ market.
If you take each area as shown on the map and look to the area number on the side of the map, it will tell you how long it would take to sell every home currently for sale if no other home came up on the market in that area.
There Were No Sellers Markets in the Seattle Area in July, 2010

King & Snohomish County Real Estate, 7-31-10
There were no sellers’ market in July. “Red” indicates a sellers’ market with homes selling in less than 3 months. If you look at the map above, all the Seattle markets are either a buyer’s market or a balanced market between buyers and sellers.
There’s a mix on Seattle’s eastside. Some markets are buyers’ markets such as West Bellevue and the Sammamish plateau cities of Sammamish, North Bend, Preston, and Fall City. Homes in these real estate markets took on average over 6 months to sell. The majority of Seattle Eastside real estate was a balanced market with homes selling between 3-6 months.
The state of the real estate market is a huge contrast from just three months ago when there was no “green” on the map at all.

- King Snohomish Counties Real Estate Market 4-30-10
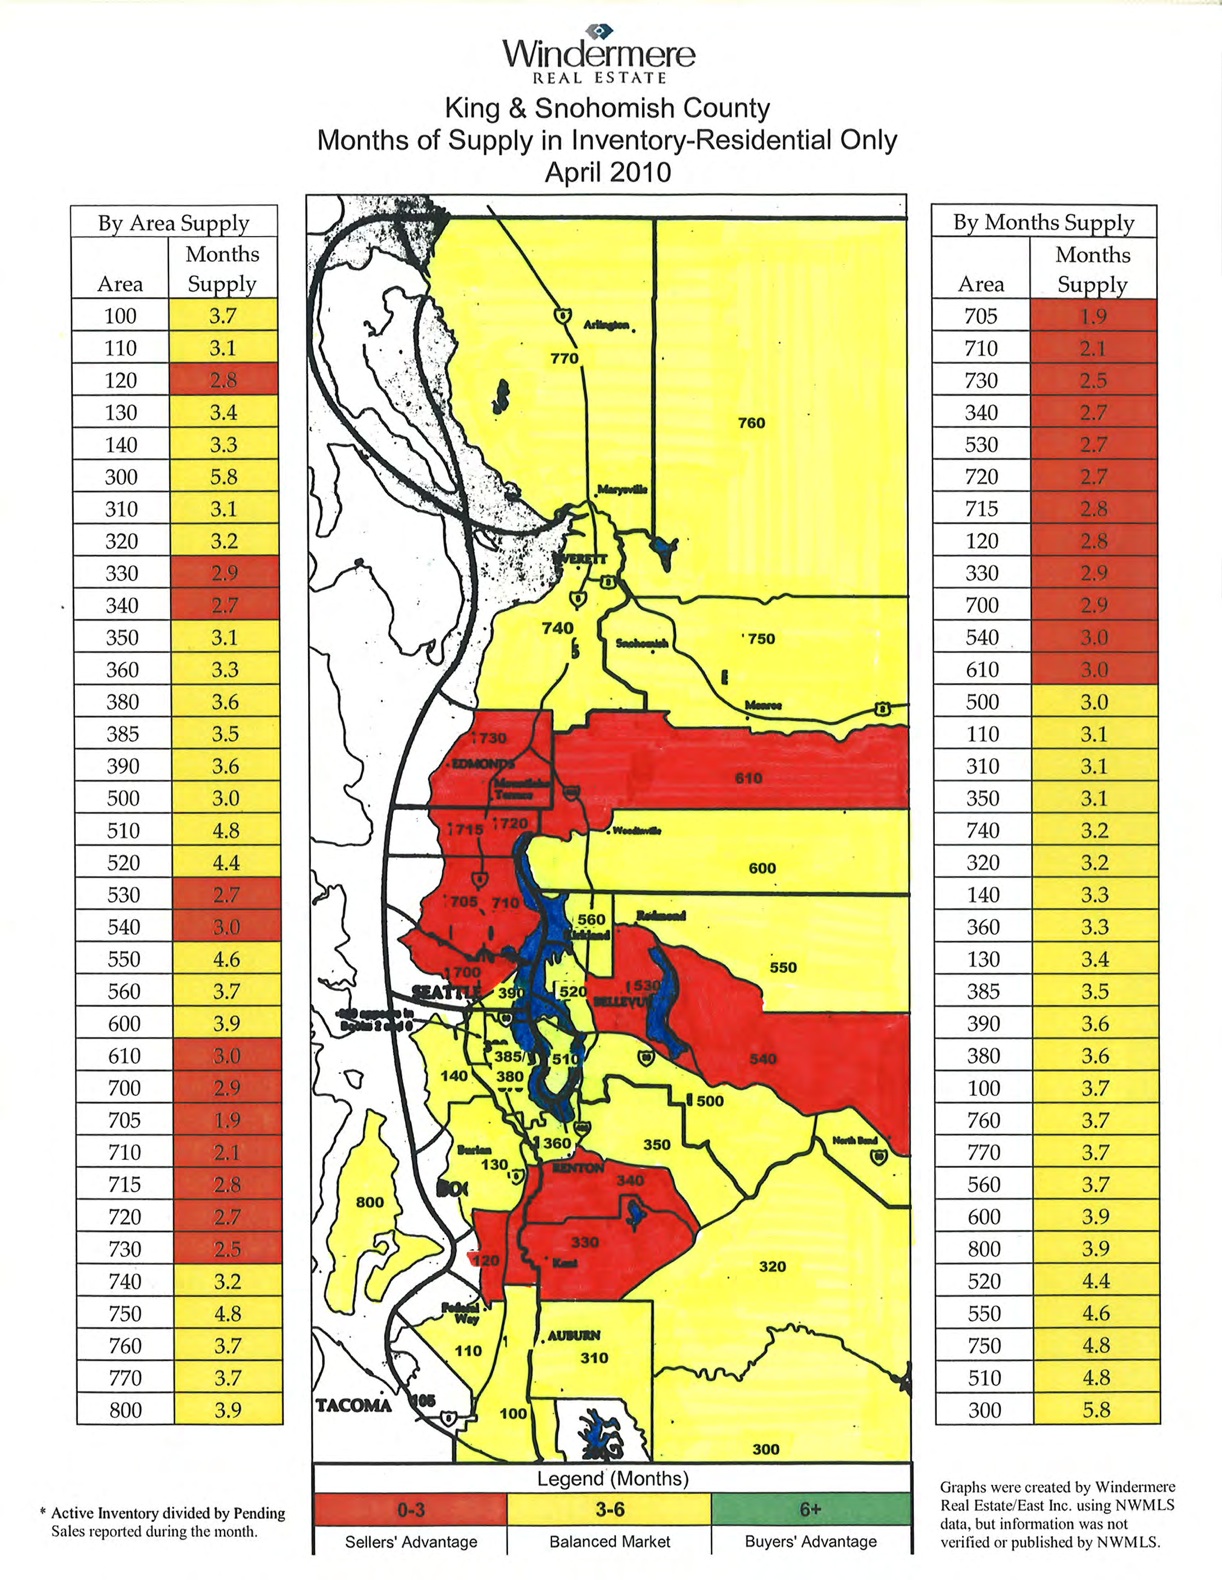
Clearly, the tax credit did its magic during that time. Is it the economy, job situation or is it the lack of urgency with interest rates slated to be low for a long time that is keeping buyers from making a home purchase? I’ve heard opinions about all three reasons as the cause for the slow moving real estate market. What do you think?
__________________________________________________________________________________
What do the numbers on the map mean?
The map is divided into the numbered areas as defined by our Northwest Multiple Listing Service (NWMLS). Downtown Bellevue is area 520 and East Bellevue is area 530, as an example.
What do the colors mean?
Red means it’s a sellers’ market, a sellers’ advantage.
Yellow means a balanced market between buyers and sellers.
Green means it’s a buyers’ market.
If you take each area as shown on the map and look to the area number on the side of the map, it will tell you how long it would take to sell every home currently for sale if no other home came up on the market in that area.
How Did July, 2010 Seattle-Eastside Real Estate Sales Stack Up In Your Neighborhood?
[googlemaps http://maps.google.com/maps?source=s_q&hl=en&geocode=&q=Seattle-eastside&sll=47.709762,-122.011414&sspn=0.310487,0.911865&ie=UTF8&split=1&radius=21.22&rq=1&ev=zo&hq=Seattle-eastside&hnear=&ll=47.709762,-122.011414&spn=0.310487,0.911865&t=h&output=embed&w=425&h=350]
How did July, 2009 stack up to July, 2010 in your neighborhood?
(Click on the cities below to see real estate trends for the past 5 years. You’ll find the median pricing for each city and whether the number of homes for sale and the number of sales went up or down. The odds of selling a home in each area is a result of the number of homes for sale divided by the actual number of home sales.)
The plateau: Sammamish, Issaquah, North Bend, and Fall City
The odds of selling a home were 12.5%.
Median sales price increased from $525,000 to $539,950.
The number of homes for sale increased by 2% and sales were down by 24% from last year.
The odds of selling a home were 16%.
Median sales price dropped from $470,000 to $422,475.
The number of homes for sale increased by 8% and sales were down 27%.
The odds of selling a home were 16.5%.
Median price decreased from $617,000 to $599,475.
The number of homes for sale dropped by 16% and sales were UP by 5%.
Woodinville/Bothell/Kenmore/Duvall/North Kirkland
The odds of selling a home were 14%.
Median price dropped by 2%, from $460,000 to $449,950.
The number of homes for sale declined by 9% and sales were down by 13.5%.
The odds of selling a home were 15%.
Median price decreased to $549,900 from $599,000.
The number of homes for sale declined by 16.5% and sales were UP by 3%.
The odds of selling a home were 11.5%.
Median pricing was UP from $950,000 to $1,299,000.
The number of homes for sale decreased by 24% and sales decreased by 31%.
Redmond/Education Hill/ Carnation
The odds of selling a home were 17%
Median pricing increased from $499,000 to $548,000.
The number of homes for sale increased by 1% and sales decreased by 5%.
Although real estate numbers are mostly down on Seattle’s eastside, 3 areas, similar to last month, showed an increase in median prices while the others all showed a reduction. Most likely, this was a result of more high end sales than seen previously this year. Many of the first time buyers bought because of the tax credit, so there are fewer first time home buyers making entry level purchases.
The high end real estate market is performing better than it was earlier this year. In July, West Bellevue had a 37% increase in the median pricing, a direct result of the homes that sold that month. This number greatly influenced the trend in the eastside showing the median pricing to increase in July. Median pricing is a function of the actual homes that sell during that particular month.
So I’d recommend not getting too excited if the median pricing went up this past month in your neighborhood. It will be important to see if the trend continues and it’s not just because more high end homes are selling.
The number of home sales were down in almost all of the Seattle eastside neighborhoods, which follows a typical pattern for summer when people choose to do other things, like go on vacation, than look for a home. Slower sales may also be impacted by the fear about jobs and the economy.
How Did June, 2010 Seattle-Eastside Real Estate Sales Stack Up in Your Neighborhood
[googlemaps http://maps.google.com/maps?source=s_q&hl=en&geocode=&q=Seattle-eastside&sll=47.709762,-122.011414&sspn=0.310487,0.911865&ie=UTF8&split=1&radius=21.22&rq=1&ev=zo&hq=Seattle-eastside&hnear=&ll=47.709762,-122.011414&spn=0.310487,0.911865&t=h&output=embed&w=425&h=350]
How did June, 2009 stack up to June, 2010 in your neighborhood?
(Click on the cities below to see real estate trends for the past 5 years. You’ll find the median pricing for each city and whether the number of homes for sale and the number of sales went up or down. The odds of selling a home in each area is a result of the number of homes for sale divided by the actual number of home sales.)
The plateau: Sammamish, Issaquah, North Bend, and Fall City
The odds of selling a home were 16%.
Median sales price increased from $499,950 to $525,000.
The number of homes for sale dropped by 10% and sales were down by 27% from last year.
The odds of selling a home were 23%.
Median sales price dropped from $499,950 to $482,500.
The number of homes for sale dropped by 4% and sales were UP by 3%.
The odds of selling a home were 18%.
Median price decreased from $610,000 to $599,994.
The number of homes for sale dropped by 15% and sales were down by 3%.
Woodinville/Bothell/Kenmore/Duvall/North Kirkland
The odds of selling a home were 14%.
Median price remained essentially equal to last year, $419,950 to $419,973 this year.
The number of homes for sale declined by 3% and sales were down by 23%.
The odds of selling a home were 13%.
Median price increased to $624,950 from $596,925.
The number of homes for sale declined by 19% and sales were down by 28%.
The odds of selling a home were 14%.
Median pricing was UP from $849,000 to $890,000.
The number of homes for sale decreased by 24% and sales decreased by 25.5%.
Redmond/Education Hill/ Carnation
The odds of selling a home were 9%
Median pricing decreased from $529,950 to $474,950.
The number of homes for sale decreased by 4% and sales decreased by 42%.
Although real estate numbers are mostly down on Seattle’s eastside, 3 areas showed an increase in median prices and one area remained similar in pricing to last June. West Bellevue, the Sammamish plateau areas, and Woodinville, North Kirkland, Bothell and Kenmore had a 5% increase in sales prices. Last month, West Bellevue was the only area with an increase in median pricing over last year and that was at 17%.
The three other Seattle-eastside neighborhoods experienced a reduction in sales prices. These areas are South Bellevue, Redmond and Bellevue near Microsoft, and the downtown area of Redmond.
The number of homes for sale is near the highest for this year, but still 11% less than the number of homes for sale on the eastside last year, so that’s a good thing.
I expect the numbers to be down over the next month or two as summer is one of the slower times in Eastside real estate. Traditionally, people take a lot of time to enjoy the sun and the outdoors, since it is so fleeting.
Interest Rates Are The Lowest in the Last 30 Years

Interest Rates 1980-2010
I remember when I bought my first home in the mid 1980’s. I was so excited, the interest rate was at the bottom of the double digits, considering what the early 80’s had to offer with rates in the high teens. I had friends who purchased in Brooklyn, NY in the early 80’s and were paying almost 17% for their mortgage. The interest rate for my first home was just above 10%. Granted the home prices were significantly less, but the monthly payments were high, considering the lower prices of the times.
Fast forward to 2010, with interest rates the lowest in 30 years and prices at 2005 levels.
What’s the difference in monthly payments with the more recent interest rates we’ve seen?
If you decide to purchase a $400,000 home, this is the difference in principle and interest payments over the last couple of years.
July 2008 – 5.75% – $2,334
July 2009 – 5.25% – $2,209
Jan 2010 – 5.125%- $2,178
May 2010 – 5.0% – $2,147
July 2010 – 4.50% – $2,027
Seattle-eastside home values have dropped significantly since the peak in the real estate market in the summer of 2007 and rates have also dropped as well. If you were to purchase a $400,000 home now, the payment would be approximately $300 less than two years ago, plus the home prices are also lower. In King County, WA, the choices are terrific because the number of homes for sale is just below the high so far for the year. Right now, in King County, there are 13,921 homes for sale.
So is it the right time to buy a home? You decide.
Which Homes are Selling on Seattle's Eastside?

Seattle-eastside Real Estate Sales 2010-1st quarter
The eastside sales here include South Bellevue and Issaquah all the way up to the Snohomish County line and from Lake Washington out to North Bend, Duvall, and Carnation.
If you look at the real estate statistics above:
Almost half of these Seattle-eastside real estate sales were below $500,000.
Over 80% of the eastside home sales were below $750,000.
Twenty-seven home sales were below $250,000.
Thirty-six home sales out of the 1119 were priced above $1,500,000.
Only 2% of the sales were above $2,000,000. Out of 1119 home sales, only 18 were priced above this $2,000,000 mark.
24% of eastside sales were short sales or bank owned properties, contrary to what many think. Most of the homes were sold by the actual home owner.
The sweet spot in Seattle-eastside real estate is between $250-500,000, with many of the homes priced between $350-500,000. Pre-2008, the sweet spot was the $500-750,000 price point.
Are Some Home Buyers More Demanding in Today's Real Estate Market?
Demanding home buyers? The New York Times had an article about home buyers being more demanding. I’ve seen it in action on Seattle’s eastside.
In recent home sales, not only do the buyers want a good price for the home, which is expected the way the real estate market has been, but some home buyers don’t want to buy a home unless the systems are all new or newer. Buyers have asked for a new furnace when the furnace worked fine and money to cover a future roof replacement that would not be happening in a condo complex for at least five years. Buyers are asking for replacements for systems that are older, but still working.

Are you seeing the same thing happen with some home buyers?
"Green" is Back on the Seattle-Eastside's Real Estate Map, May, 2010

Home Sales Activity for King and Snohomish Counties, May, 2010
During May “green” crept back into a number of Seattle areas. One large area on the eastside, Woodinville, Bothell, Kenmore, Duvall, and north Kirkland was “green,” back as a buyer’s market.
April was the first month in a very long time in which there was no ” green,” no buyers’ markets in almost all the Seattle-eastside areas. In April, the Seattle area real estate market was the strongest in years. This is most likely a direct result of the 2010 tax credit. Both buyers and sellers were rushing to buy and sell before the expiration of the credit.
May represented a lull in the Seattle real estate market. Was this a temporary lull or our new normal? The next several months will be good indicators, although summer tends to be a slower time every year in Seattle real estate. Home buyers and sellers are like everyone else. Seattleites play outside in summer. Of course, that’s providing the sun ever comes out this year!
The good real estate news is there are still great homes and condos out there to buy and interest rates are at historic lows. The loss of the tax credit may not make much of a difference when calculating the savings in monthly payments over time.

Interest Rates 6-2010
It may be the fall before we can determine the true pace of Seattle real estate. I’ll keep you posted.
- King Snohomish Counties Real Estate Market 4-30-10
What do the numbers on the map mean?
The map is divided into the numbered areas as defined by our Northwest Multiple Listing Service (NWMLS). Downtown Bellevue is area 520 and East Bellevue is area 530, as an example.
What do the colors mean?
Red means it’s a sellers’ market, a sellers’ advantage.
Yellow means a balanced market between buyers and sellers.
Green means it’s a buyers’ market.
If you take each area as shown on the map and look to the area number on the side of the map, it will tell you how long it would take to sell every home currently for sale if no other home came up on the market in that area.
How Did May, 2010 Seattle-Eastside Real Estate Sales Stack Up in Your Neighborhood
[googlemaps http://maps.google.com/maps?source=s_q&hl=en&geocode=&q=Seattle-eastside&sll=47.709762,-122.011414&sspn=0.310487,0.911865&ie=UTF8&split=1&radius=21.22&rq=1&ev=zo&hq=Seattle-eastside&hnear=&ll=47.709762,-122.011414&spn=0.310487,0.911865&t=h&output=embed&w=425&h=350]
How did May, 2009 stack up to May, 2010 in your neighborhood?
(Click on the cities below to see real estate trends for the past 5 years. You’ll find the median pricing for each city and whether the number of homes for sale and the number of sales went up or down. The odds of selling a home in each area is a result of the number of homes for sale divided by the actual number of home sales.)
The plateau: Sammamish, Issaquah, North Bend, and Fall City
The odds of selling a home were 20.5%.
Median sales price increased from $524,950 to $559,880.
The number of homes for sale dropped by 20% and sales were up by 6% from last year.
The odds of selling a home were 18%.
Median sales price dropped from $515,000 to $480,000.
The number of homes for sale dropped by 10% and sales were down by 7.5%.
The odds of selling a home were 16%.
Median price increased to $624,975 from $619,000.
The number of homes for sale dropped by 19% and sales were down by 6%.
Woodinville/Bothell/Kenmore/Duvall/North Kirkland
The odds of selling a home were 12%.
Median price decreased to $451,126 from $459,500.
The number of homes for sale declined by 8% and sales were down by 22%.
The odds of selling a home were 15%.
Median price decreased to $599,000 from $599,950.
The number of homes for sale declined by 25% and sales were up by 3%.
The odds of selling a home were 19%.
Median pricing was up from $1,097,000 to $1,280,000.
The number of homes for sale decreased by 23% and sales decreased by 12.5%.
Redmond/Education Hill/ Carnation
The odds of selling a home were 15.5%
Median pricing decreased from $569,895 to $519,950.
The number of homes for sale decreased by 17% and sales decreased by 18%.
When compared to May, 2009, only one area of Seattle’s eastside showed an increase in median prices. West Bellevue had the highest with a 17% increase in sales prices. Last month the area had the most significant decrease in pricing. The return of some strength to the high end market is a good sign. The high end was the least affected by the tax credit.
Most other Seattle-eastside neighborhoods experienced a reduction in sales prices.
Home sales also took a dip in most areas of the eastside. Two areas, Kirkland and the plateau area of Sammamish, had increased home sales, but only in the single digits.
Seventeen percent less homes are for sale on the eastside this year than last year.
Has your area seen a drop in home sales since the expiration of the tax credit?
