
 Facebook
 X
X
 Pinterest
 Copy Link
How Was The Seattle-Eastside Real Estate Market in October, 2010?
It Was Mostly a Buyers' Market on Seattle's Eastside in September, 2010

King & Snohomish County Reat Estate, 9-30-10
Sellers’ markets on this map are in red and there is no red in Seattle or on Seattle’s eastside. Most of the neighborhoods are buyers’ markets, which are in green. Only two areas, Bellevue and Redmond near Microsoft, which is area 530, and area 600, which is Woodinville, Bothell, Duvall, are balanced markets. Last month, Bellevue and Redmond near Microsoft and Kirkland were the balanced markets.
A balanced market is when homes on average are selling between 3-6 months, which means there was a level playing field between buyers and sellers in those areas for that particular month. A buyers’ market means the homes on average are taking longer than 6 months to sell and a sellers’ market means the homes take less than 3 months to sell.
A real estate market is labeled a buyer or sellers’ market depending on the homes that actually sold that particular month. Since the sales can vary each month, the type of real estate market can very easily change, going back and forth between a buyer or seller advantage. Don’t count on the market staying the same each month in any area.
Remember, too, an area may be a buyers’ market and there can still be a terrific home that’s the best of the competition and sells with multiple offers or for full price. It’s always important to understand how much competition a particular home has and how well priced it is when compared to the competition. So look at the overall real estate market, look at the market in your neighborhood, and then look at the specific home and how well it’s priced for that market. Weigh all of this information when making a buying decision or a decision as to how to price your home.
What do the numbers on the map mean?
The map is divided into the numbered areas as defined by our Northwest Multiple Listing Service (NWMLS). Downtown Bellevue is area 520 and East Bellevue is area 530, as an example.
What do the colors mean?
Red means it’s a sellers’ market, a sellers’ advantage.
Yellow means a balanced market between buyers and sellers.
Green means it’s a buyers’ market.
If you take each area as shown on the map and look to the area number on the side of the map, it will tell you how long it would take to sell every home currently for sale if no other home came up on the market in that area.
How Did September, 2010 Seattle-Eastside Real Estate Sales Do In Your Neighborhood?
[googlemaps http://maps.google.com/maps?source=s_q&hl=en&geocode=&q=Seattle-eastside&sll=47.709762,-122.011414&sspn=0.310487,0.911865&ie=UTF8&split=1&radius=21.22&rq=1&ev=zo&hq=Seattle-eastside&hnear=&ll=47.709762,-122.011414&spn=0.310487,0.911865&t=h&output=embed&w=425&h=350]
How did September, 2009 compare to September, 2010 in your neighborhood?
(Click on the cities below to see real estate trends for the past 5 years. You’ll find the median pricing for each city and whether the number of homes for sale and the number of sales went up or down. The odds of selling a home in each area is a result of the number of homes for sale divided by the actual number of home sales, so if 10 out of 100 homes sold, the odds of selling would be 10/100 or 10%)
The plateau: Sammamish, Issaquah, North Bend, and Fall City
The odds of selling a home were 13%.
Median sales price increased from $493,995 $500,000.
The number of homes for sale increased by 15% and sales were down by 25% from last year.
The odds of selling a home were 17%.
Median sales price decreased to $464,750 from $499,500.
The number of homes for sale was up by 15% and sales were down by 25%.
The odds of selling a home were 13%.
Median price decreased to $520,000 from $564,900.
The number of homes for sale dropped by 8% and sales were down by 4%.
Woodinville/Bothell/Kenmore/Duvall/North Kirkland
The odds of selling a home were 14%.
Median price was down from $399,975 to $389,500.
The number of homes for sale declined by 6% and sales were down by 15%.
The odds of selling a home were 13%.
Median price increased to $599,000 from $549,950.
The number of homes for sale declined by 8% and sales were down by 17%.
The odds of selling a home were 13%.
Median pricing was down from $1,012,000 to $899,000.
The number of homes for sale decreased by 15% and sales decreased by 30%. (Another big hit!)
Redmond/Education Hill/ Carnation
The odds of selling a home were 14.5 %
Median pricing increased from $449,950 to $499,925.
The number of homes for sale increased by 5% and sales decreased by 2%.
The real estate sales numbers are down on Seattle’s eastside, which is no big surprise to many of us. However, again we see median pricing up in 3 out of 7 neighborhoods. Don’t get too excited though. The median pricing is based on the homes that sold that month, not on the trend for the whole year. I can safely say median pricing is down since last year all over the eastside, even if a month or two shows an increase. We have to look at the overall trend for the year.
Sales were down by a lot, 30% in West Bellevue. In East Bellevue/Redmond near Microsoft and on the Sammamish plateau, sales were down by 25%. These are big numbers.
The number of homes for sale on Seattle’s eastside is starting to head downward. (This is a good thing.) There are 400 fewer homes on the market in King County than just a few weeks ago. I expect to see that number continue to drop.
What real estate activity have you seen in your neighborhood?
How Was The Seattle-Eastside Real Estate Market in September, 2010?

Seattle-Eastside Real Estate Sales, September 2010
So how was the September real estate market on Seattle’s eastside?
The odds of selling a home on the Eastside in September ranged from 13% to 17%, with an average 14% absorption rate.* Most home sellers on Seattle’s eastside had a 14/100 change of selling their home last month. The absorption rates were pretty consistent throughout the whole eastside.
*(The absorption rate is the number of homes for sale in any given month divided by the actual number of homes sold that month. If the absorption rate is 10%, then 10 out of 100 homes sold that month.)
September, 2010 3487 homes for sale 475 homes sold 14% odds of selling.
August, 2010 3492 homes for sale 473 (was 491) homes sold 13.5% (was 15%) odds of selling.*
September, 2009 3518 homes for sale 581 homes sold 19.5% odds of selling.
*(Some home sales fail because of the buyer financing or an inspection. The number of sales is updated when we find out the actual number of homes that sold during that time.)
_____________________________________________________________
September, 2009 Seattle-Eastside real estate market compared to September, 2010:
- The average price of pending homes (recently sold homes) went from $532,922 to $521,576. Two neighborhoods showed an increase in prices for the month.
- As of this past week, there were 13,867 King County homes (houses and condos) for sale.
- The number of homes sold on Seattle’s Eastside: down 18% from last year.
- Number of homes for sale on Seattle’s Eastside: Almost 250 more homes for sale than last year.
- The reality is the actual number of homes selling has not changed all that much, it’s the competition that has increased by a huge margin. Since it is more competitive out there, the homes that are priced right and show well are the homes the buyers pick to buy.
Best odds of selling: Redmond, near Microsoft, and East Bellevue.
Worst odds of selling: West Bellevue, although it’s within a hair of most all the other eastside neighborhoods.
Biggest increase in sales from last year: None, there was no increase in home sales from last year to this year in any of the eastside areas.
Smallest increase in sales from last year: No increases.
Decline in home sales from last year: There was a decline in 7 out of the 7 Seattle-eastside areas. West Bellevue had the largest decline in home sales with 30% decline in the number of homes sold. The Sammamish plateau area and the Redmond/East Bellevue area around Microsoft both had 25% decline in home sales.
The peak of homes for sale in 2008: July, 4370 homes.
The peak of homes for sale in 2009: June, 3859 homes.
The number of eastside homes for sale at the start of 2010: 2584 homes
The number of eastside homes for sale now: 3487 homes.
For a picture of King County sales, check out The Seattle Times.
What are you seeing in your neighborhood? Are some doing better than others?
What Were The Odds of Selling Your Seattle-Eastside Home in August, 2010?

Seattle-Eastside Real Estate, August 2010
The odds of selling a home on the Eastside in August, 2010 ranged from a low of 6% to a high of 21%, with an average 14% absorption rate. This month, West Bellevue is in the single digits, at 6%.
The real estate activity in the summer months has turned out to be very different than the activity in the spring. Clearly, both buyers and sellers rushed to buy and sell before the tax credit expired. We have a buyers’ market for most of the eastside again, which means buyers can choose from a variety of nice homes and probably not find other buyers competing with them.
(The absorption rate is the number of homes for sale in any given month divided by the actual number of homes sold that month.)
August, 2010 3492 homes for sale 491 homes sold 15% odds of selling.
July, 2010 3468 homes for sale 470 homes sold 13.5% odds of selling.
August, 2009 3604 homes for sale 580 homes sold 16% odds of selling.
_____________________________________________________________
August, 2009 Seattle-Eastside real estate market compared to August, 2010:
- The average price of pending homes (recently sold homes) went from $543,639 to $532,692. Some neighborhoods showed an increase in prices for the month.
- As of this past week, there were 14,333 King County homes (houses and condos) for sale, less than late July’s high of 14,639.
- Home sales on Seattle’s Eastside: down 2.5% from last August’s number.
- Number of homes for sale on Seattle’s Eastside: down 3% from last year.
- The reality is some homes are selling well, but it is only those homes priced well and showing well.
Best odds of selling: Redmond, near Microsoft, and East Bellevue.
Worst odds of selling: West Bellevue
Biggest increase in sales from last year: An 8% increase in home sales in Redmond, near Microsoft and East Bellevue.
Smallest increase in sales from last year: Same as above. This area had the only increase in Seattle-eastside home sales in August.
Decline in real estate sales from last year: There was a decline in 6 out of the 7 Seattle-eastside areas. West Bellevue had the largest decline in home sales with 65% decline in the number of homes sold.
The peak of homes for sale in 2008: July, 4370 homes.
The peak of homes for sale in 2009: June, 3859 homes.
The number of eastside homes for sale at the start of 2010: 2584 homes
The number of eastside homes for sale now: 3492 homes.
For a picture of King County sales, check out The Seattle Times.
How Did August, 2010 Seattle-Eastside Real Estate Sales Stack Up In Your Neighborhood?
[googlemaps http://maps.google.com/maps?source=s_q&hl=en&geocode=&q=Seattle-eastside&sll=47.709762,-122.011414&sspn=0.310487,0.911865&ie=UTF8&split=1&radius=21.22&rq=1&ev=zo&hq=Seattle-eastside&hnear=&ll=47.709762,-122.011414&spn=0.310487,0.911865&t=h&output=embed&w=425&h=350]
How did August, 2009 stack up to August, 2010 in your neighborhood?
(Click on the cities below to see real estate trends for the past 5 years. You’ll find the median pricing for each city and whether the number of homes for sale and the number of sales went up or down. The odds of selling a home in each area is a result of the number of homes for sale divided by the actual number of home sales.)
The plateau: Sammamish, Issaquah, North Bend, and Fall City
The odds of selling a home were 16%.
Median sales price decreased from $515,000 $479,895.
The number of homes for sale increased by 9% and sales were down by 17% from last year.
The odds of selling a home were 21%.
Median sales price increased to $494,900 from $475,000.
The number of homes for sale were up by 4% and sales were UP by 8%.
The odds of selling a home were 14%.
Median price increased to $550,000 from $499,500.
The number of homes for sale dropped by 13% and sales were down by 26%.
Woodinville/Bothell/Kenmore/Duvall/North Kirkland
The odds of selling a home were 13%.
Median price was down from $425,000 to $415,000.
The number of homes for sale declined by 2% and sales were down by 27%.
The odds of selling a home were 14%.
Median price increased to $641,000 from $581,919.
The number of homes for sale declined by 13% and sales were down by 27%.
The odds of selling a home were 6%.
Median pricing was down from $899,475 to $869,000.
The number of homes for sale decreased by 16% and sales decreased by 65%. (Ouch!)
Redmond/Education Hill/ Carnation
The odds of selling a home were 15%
Median pricing increased from $542,250 to $549,950.
The number of homes for sale increased by 12% and sales decreased by 10%.
Real estate sales numbers are down on Seattle’s eastside, with the exception of one area. The East Bellevue and Redmond area near Microsoft showed a slight increase in the number of homes sold. This area was also the only area to show an increase in median price, number of homes on the market (not so good), and number of homes sold. However, median pricing was up in 3 other areas, South Bellevue and Issaquah, Kirkland, and Redmond and Carnation.
The number of homes for sale on Seattle’s eastside is the highest for this year, but should be experiencing a downward swing as we head into fall. Right now, though, there are a lot of choices out there and not as many buyers to compete with. Good buys are out there if you take your time and check out the homes for sale.
What real estate activity have you seen in your neighborhood?
Seattle-Eastside Real Estate is Mostly Green, A Buyers' Market

- King & Snohomish County Real Estate Activity 8-31-10
The Seattle-eastside has flipped back almost completely to a buyers’ market. Two areas, Redmond and East Bellevue near Microsoft and Kirkland, were more balanced real estate markets, with the market time to sell a home falling between 3 to 6 months. If you check out what the colors represent below, you can see how much of King County real estate is in the buyers’ camp right now. With today’s low interest rates and the ability to negotiate strongly because of this market trend, it’s probably a better time to buy a home now than when everyone was rushing to beat the expiration of the tax credit. The savings would be spread out over a longer time period, but would be worth far more than the one time $8000 tax credit. If you do decide to buy, remember to look for a home you can grow in that’s close to transportation, shopping, schools, and jobs. A home that meets these criteria will hold its value better.
What do the numbers on the map mean?
The map is divided into the numbered areas as defined by our Northwest Multiple Listing Service (NWMLS). Downtown Bellevue is area 520 and East Bellevue is area 530, as an example.
What do the colors mean?
Red means it’s a sellers’ market, a sellers’ advantage.
Yellow means a balanced market between buyers and sellers.
Green means it’s a buyers’ market.
If you take each area as shown on the map and look to the area number on the side of the map, it will tell you how long it would take to sell every home currently for sale if no other home came up on the market in that area.
There Were No Sellers Markets in the Seattle Area in July, 2010

King & Snohomish County Real Estate, 7-31-10
There were no sellers’ market in July. “Red” indicates a sellers’ market with homes selling in less than 3 months. If you look at the map above, all the Seattle markets are either a buyer’s market or a balanced market between buyers and sellers.
There’s a mix on Seattle’s eastside. Some markets are buyers’ markets such as West Bellevue and the Sammamish plateau cities of Sammamish, North Bend, Preston, and Fall City. Homes in these real estate markets took on average over 6 months to sell. The majority of Seattle Eastside real estate was a balanced market with homes selling between 3-6 months.
The state of the real estate market is a huge contrast from just three months ago when there was no “green” on the map at all.

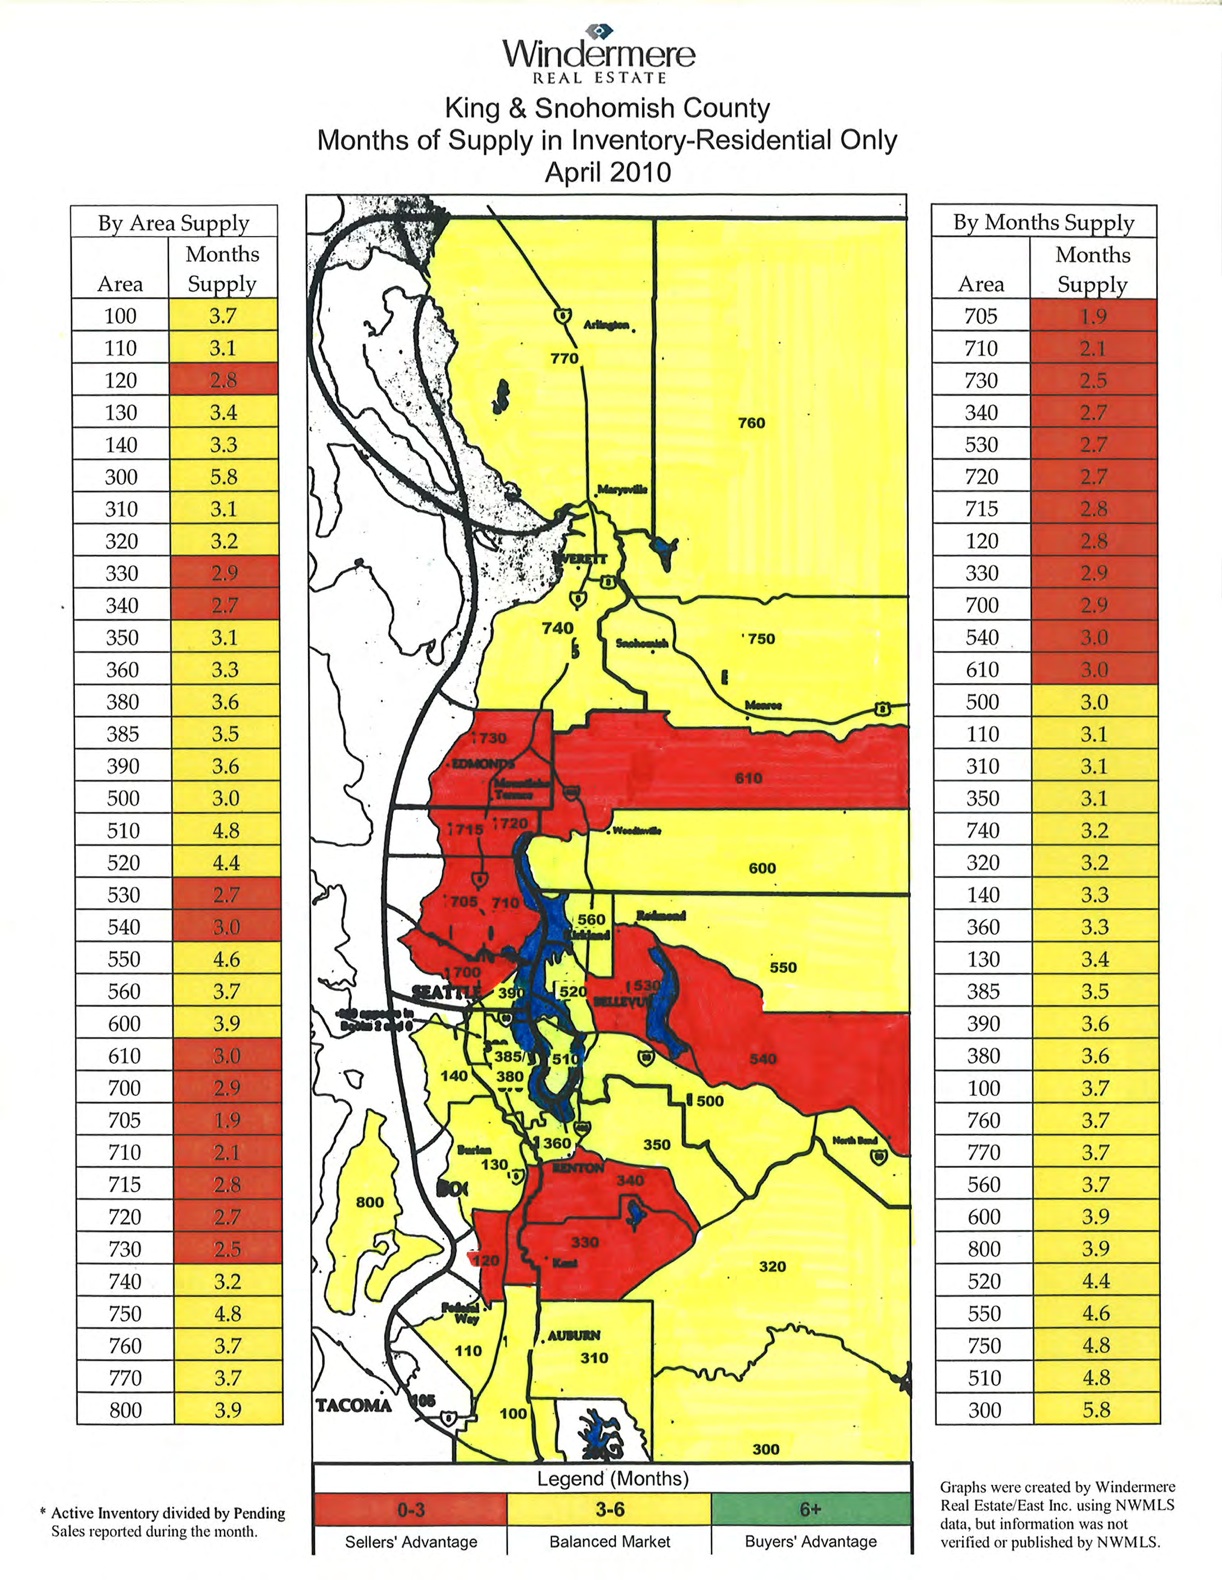
- King Snohomish Counties Real Estate Market 4-30-10
Clearly, the tax credit did its magic during that time. Is it the economy, job situation or is it the lack of urgency with interest rates slated to be low for a long time that is keeping buyers from making a home purchase? I’ve heard opinions about all three reasons as the cause for the slow moving real estate market. What do you think?
__________________________________________________________________________________
What do the numbers on the map mean?
The map is divided into the numbered areas as defined by our Northwest Multiple Listing Service (NWMLS). Downtown Bellevue is area 520 and East Bellevue is area 530, as an example.
What do the colors mean?
Red means it’s a sellers’ market, a sellers’ advantage.
Yellow means a balanced market between buyers and sellers.
Green means it’s a buyers’ market.
If you take each area as shown on the map and look to the area number on the side of the map, it will tell you how long it would take to sell every home currently for sale if no other home came up on the market in that area.
How Did July, 2010 Seattle-Eastside Real Estate Sales Stack Up In Your Neighborhood?
[googlemaps http://maps.google.com/maps?source=s_q&hl=en&geocode=&q=Seattle-eastside&sll=47.709762,-122.011414&sspn=0.310487,0.911865&ie=UTF8&split=1&radius=21.22&rq=1&ev=zo&hq=Seattle-eastside&hnear=&ll=47.709762,-122.011414&spn=0.310487,0.911865&t=h&output=embed&w=425&h=350]
How did July, 2009 stack up to July, 2010 in your neighborhood?
(Click on the cities below to see real estate trends for the past 5 years. You’ll find the median pricing for each city and whether the number of homes for sale and the number of sales went up or down. The odds of selling a home in each area is a result of the number of homes for sale divided by the actual number of home sales.)
The plateau: Sammamish, Issaquah, North Bend, and Fall City
The odds of selling a home were 12.5%.
Median sales price increased from $525,000 to $539,950.
The number of homes for sale increased by 2% and sales were down by 24% from last year.
The odds of selling a home were 16%.
Median sales price dropped from $470,000 to $422,475.
The number of homes for sale increased by 8% and sales were down 27%.
The odds of selling a home were 16.5%.
Median price decreased from $617,000 to $599,475.
The number of homes for sale dropped by 16% and sales were UP by 5%.
Woodinville/Bothell/Kenmore/Duvall/North Kirkland
The odds of selling a home were 14%.
Median price dropped by 2%, from $460,000 to $449,950.
The number of homes for sale declined by 9% and sales were down by 13.5%.
The odds of selling a home were 15%.
Median price decreased to $549,900 from $599,000.
The number of homes for sale declined by 16.5% and sales were UP by 3%.
The odds of selling a home were 11.5%.
Median pricing was UP from $950,000 to $1,299,000.
The number of homes for sale decreased by 24% and sales decreased by 31%.
Redmond/Education Hill/ Carnation
The odds of selling a home were 17%
Median pricing increased from $499,000 to $548,000.
The number of homes for sale increased by 1% and sales decreased by 5%.
Although real estate numbers are mostly down on Seattle’s eastside, 3 areas, similar to last month, showed an increase in median prices while the others all showed a reduction. Most likely, this was a result of more high end sales than seen previously this year. Many of the first time buyers bought because of the tax credit, so there are fewer first time home buyers making entry level purchases.
The high end real estate market is performing better than it was earlier this year. In July, West Bellevue had a 37% increase in the median pricing, a direct result of the homes that sold that month. This number greatly influenced the trend in the eastside showing the median pricing to increase in July. Median pricing is a function of the actual homes that sell during that particular month.
So I’d recommend not getting too excited if the median pricing went up this past month in your neighborhood. It will be important to see if the trend continues and it’s not just because more high end homes are selling.
The number of home sales were down in almost all of the Seattle eastside neighborhoods, which follows a typical pattern for summer when people choose to do other things, like go on vacation, than look for a home. Slower sales may also be impacted by the fear about jobs and the economy.
What Were The Odds of Selling Your Seattle-Eastside Home in July, 2010?

Seattle-Eastside Residential Real Estate Sales, July 2010
The odds of selling a home on the Eastside in July, 2010 ranged from a low of 11.5% to a high of 17%, with an average 14% absorption rate.(The absorption rate is the number of homes for sale in a month divided by the actual number of homes sold that month.)
July, 2010 3468 homes for sale 501 homes sold 14% odds of selling.
June, 2010 3360 homes for sale 475 (was 503) homes sold 14%(was 15%) odds of selling.*
May, 2010 3209 homes for sale 492 homes sold 15% odds of selling.*
July, 2009 3819 homes for sale 516 homes sold 13.5 % odds of selling.
June, 2009 3859 homes for sale 563 homes sold 15% odds of selling.
*Adjusted from previous month’s numbers to reflect the actual number of homes sold and closed. Each month some sales fall apart and don’t close. A lower number of home sales may be reported at a later date to show the actual number of sales that did close.
For the past few months, the absorption rate for all the Seattle-eastside areas has been in the teens, hovering around 13-15%. May, June, and July all had similar absorption rates. Since May of 2009, the number of homes that have sold each month has not varied all that much, with the exception of March and April of this year. March and April had higher sales because of the tax credit.
Where we see more of a difference is in the number of homes for sale on Seattle’s eastside. Last year there were 3819 homes for sale in July, 2009. This year there are 10% less homes on the market. But even with less homes on the market, the odds of selling are about the same.
We have the lowest interest rates since 1971. Plus, our Seattle eastside real estate market is clearly a buyers’ market again, since the absorption rate is so low. It’s very obvious when shown on a map of the area. I’ll post a map of the Seattle eastside showing where buyers and sellers markets are located later this week. The reality is, however, that most of the real estate markets are buyers’ markets right now.
So why are real estate sales so sluggish? My guess is the “fear factor.” People are still worried about the economy. Plus, with interest rates predicted to remain low for the foreseeable future, there’s also no sense of urgency to buy.
Why do you think the Seattle eastside real estate market is slower?
_____________________________________________________________
July, 2009 Seattle-Eastside real estate market compared to July, 2010:
- The average asking price of pending homes (recently sold homes) went from $558,397 to $573,617. (This does not show what the homes actually sold for.)
- This week, there were 14,414 King County homes (houses and condos) for sale.
- Two weeks ago may have been the peak of the number of homes for sale this year when 14,639 homes were on the market.
- Home sales on Seattle’s Eastside: down 13%.
- Number of homes for sale on Seattle’s Eastside: down 10%
Best odds of selling: Carnation and Redmond, from downtown to north and east, with 17% of the homes getting accepted offers. Ironically, last month this area had the worst odds of selling at 9%.
Worst odds of selling: West Bellevue, with 11.5% of the homes getting accepted offers.
Biggest increase in sales from last year: A 5% increase in South Bellevue home sales, which is the biggest increase.
Smallest increase in sales from last year: Kirkland, with a 3% increase. There were only two areas with an increase in the number of home sales on Seattle’s eastside.
Decline in real estate sales from last year: There was a decline in 5 out of the 7 Seattle-eastside areas with the largest decline in home sales in West Bellevue with a 31% decline in the number of homes sold.
The peak of homes for sale in 2008: July, 4370 homes.
The peak of homes for sale in 2009: June, 3859 homes.
The number of eastside homes for sale at the start of 2010: 2584 homes
The number of eastside homes for sale in July, 2010: 3468 homes.
Rate of home sales that failed and did not close: 6%
For a picture of King County sales, check out The Seattle Times. The headline states sales are down, but prices are up. Keep in mind the headline may not represent each area. Prices are up slightly in some areas, down in others, and sales are down in 5 out of 7 eastside areas.
