
 Facebook
 X
X
 Pinterest
 Copy Link
How Did June, 2010 Seattle-Eastside Real Estate Sales Stack Up in Your Neighborhood
[googlemaps http://maps.google.com/maps?source=s_q&hl=en&geocode=&q=Seattle-eastside&sll=47.709762,-122.011414&sspn=0.310487,0.911865&ie=UTF8&split=1&radius=21.22&rq=1&ev=zo&hq=Seattle-eastside&hnear=&ll=47.709762,-122.011414&spn=0.310487,0.911865&t=h&output=embed&w=425&h=350]
How did June, 2009 stack up to June, 2010 in your neighborhood?
(Click on the cities below to see real estate trends for the past 5 years. You’ll find the median pricing for each city and whether the number of homes for sale and the number of sales went up or down. The odds of selling a home in each area is a result of the number of homes for sale divided by the actual number of home sales.)
The plateau: Sammamish, Issaquah, North Bend, and Fall City
The odds of selling a home were 16%.
Median sales price increased from $499,950 to $525,000.
The number of homes for sale dropped by 10% and sales were down by 27% from last year.
The odds of selling a home were 23%.
Median sales price dropped from $499,950 to $482,500.
The number of homes for sale dropped by 4% and sales were UP by 3%.
The odds of selling a home were 18%.
Median price decreased from $610,000 to $599,994.
The number of homes for sale dropped by 15% and sales were down by 3%.
Woodinville/Bothell/Kenmore/Duvall/North Kirkland
The odds of selling a home were 14%.
Median price remained essentially equal to last year, $419,950 to $419,973 this year.
The number of homes for sale declined by 3% and sales were down by 23%.
The odds of selling a home were 13%.
Median price increased to $624,950 from $596,925.
The number of homes for sale declined by 19% and sales were down by 28%.
The odds of selling a home were 14%.
Median pricing was UP from $849,000 to $890,000.
The number of homes for sale decreased by 24% and sales decreased by 25.5%.
Redmond/Education Hill/ Carnation
The odds of selling a home were 9%
Median pricing decreased from $529,950 to $474,950.
The number of homes for sale decreased by 4% and sales decreased by 42%.
Although real estate numbers are mostly down on Seattle’s eastside, 3 areas showed an increase in median prices and one area remained similar in pricing to last June. West Bellevue, the Sammamish plateau areas, and Woodinville, North Kirkland, Bothell and Kenmore had a 5% increase in sales prices. Last month, West Bellevue was the only area with an increase in median pricing over last year and that was at 17%.
The three other Seattle-eastside neighborhoods experienced a reduction in sales prices. These areas are South Bellevue, Redmond and Bellevue near Microsoft, and the downtown area of Redmond.
The number of homes for sale is near the highest for this year, but still 11% less than the number of homes for sale on the eastside last year, so that’s a good thing.
I expect the numbers to be down over the next month or two as summer is one of the slower times in Eastside real estate. Traditionally, people take a lot of time to enjoy the sun and the outdoors, since it is so fleeting.
What Were The Odds of Selling Your Seattle-Eastside Home in June, 2010?

Seattle-Eastside Home Sales, June 2010
The odds of selling a home on the Eastside in June, 2010 ranged from a low of 9% to a high of 23%, with an average 15% absorption rate. For the past few months, the absorption rate for all the Seattle-eastside areas had been in the double digits. This month, downtown Redmond and Carnation are in the single digits, at 9%. It’s a stark contrast to April, 2010 with its low of 20% to a high of 35%, averaging a 27% absorption rate.
June’s real estate activity is more similar to May, when the numbers started looking more like last year’s real estate rather than the highs of April, 2010. It’s ironic, in a sense, the tax credit did offer buyers a true incentive to buy, but if one looks at the total picture, there still may be many opportunities to “get a deal.” With the lowest interest rates in 30 years and the higher number of homes on the market, it’s becoming more of a buyer’s market again. ( I’ll be posting the map showing the different markets later this week.) Plus, summer is the time to play outside for Seattleites, so there are usually less buyers competing for homes.
(The absorption rate is the number of homes for sale in any given month divided by the actual number of homes sold that month.)
June, 2010 3360 homes for sale 503 homes sold 15 % odds of selling.
May, 2010 3209 homes for sale 492 (was 563) homes sold 15% (was 17.5%) odds of selling.*
June, 2009 3859 homes for sale 563 homes sold 15% odds of selling.
*Adjusted from previous month’s numbers to reflect the actual number of homes sold and closed. Each month some sales fall apart and don’t close. A lower number of home sales may be reported at a later date to show the actual number of sales that did close.
_____________________________________________________________
June, 2009 Seattle-Eastside real estate market compared to June, 2010:
- Surprisingly, the average list price of pending homes (recently sold) went from $547,381 to $553,772.
- As of this past week, there were 14,235 King County homes (houses and condos) for sale.
- Is this the peak of the real estate market for the number of homes for sale this year?
- Home sales on Seattle’s Eastside: down 20%, which follows a much smaller drop of 7% in May.
- Number of homes for sale on Seattle’s Eastside: down 11%
Best odds of selling: Redmond, near Microsoft, and East Bellevue.
Worst odds of selling: Carnation and Redmond, from downtown to north and east, with 9% of the homes getting accepted offers.
Biggest increase in sales from last year: A very small 3% increase in East Bellevue and Redmond, near Microsoft, home sales.
Smallest increase in sales from last year: Same as above. This area had the only increase in Seattle-eastside home sales in June.
Decline in real estate sales from last year: There was a decline in 6 out of the 7 Seattle-eastside areas. Redmond and Carnation had the largest decline in home sales with a 43% decline in the number of homes sold. This area also had the largest decline in home sales last month.
The peak of homes for sale in 2008: July, 4370 homes.
The peak of homes for sale in 2009: June, 3859 homes.
The number of eastside homes for sale at the start of 2010: 2584 homes
The number of eastside homes for sale now: 3360 homes.
Rate of home sales that failed and did not close: 13%
The sun is out now in Seattle (although a little late today), which tends to slow Seattle Eastside real estate sales. The number of home sales could remain on the lower side in the near future for two reasons. One is the slow down after the tax credit rush and the sunny weather and summer vacations. People in Seattle like to play outside in the sun.
The slower home sales is ironic, given the high number of homes for sale, which means lots of choices and the screamingly low interest rates. I believe there are some great deals out there for buyers right now.
For a picture of King County sales, check out The Seattle Times.
Interest Rates Are The Lowest in the Last 30 Years

Interest Rates 1980-2010
I remember when I bought my first home in the mid 1980’s. I was so excited, the interest rate was at the bottom of the double digits, considering what the early 80’s had to offer with rates in the high teens. I had friends who purchased in Brooklyn, NY in the early 80’s and were paying almost 17% for their mortgage. The interest rate for my first home was just above 10%. Granted the home prices were significantly less, but the monthly payments were high, considering the lower prices of the times.
Fast forward to 2010, with interest rates the lowest in 30 years and prices at 2005 levels.
What’s the difference in monthly payments with the more recent interest rates we’ve seen?
If you decide to purchase a $400,000 home, this is the difference in principle and interest payments over the last couple of years.
July 2008 – 5.75% – $2,334
July 2009 – 5.25% – $2,209
Jan 2010 – 5.125%- $2,178
May 2010 – 5.0% – $2,147
July 2010 – 4.50% – $2,027
Seattle-eastside home values have dropped significantly since the peak in the real estate market in the summer of 2007 and rates have also dropped as well. If you were to purchase a $400,000 home now, the payment would be approximately $300 less than two years ago, plus the home prices are also lower. In King County, WA, the choices are terrific because the number of homes for sale is just below the high so far for the year. Right now, in King County, there are 13,921 homes for sale.
So is it the right time to buy a home? You decide.
Which Homes are Selling on Seattle's Eastside?

Seattle-eastside Real Estate Sales 2010-1st quarter
The eastside sales here include South Bellevue and Issaquah all the way up to the Snohomish County line and from Lake Washington out to North Bend, Duvall, and Carnation.
If you look at the real estate statistics above:
Almost half of these Seattle-eastside real estate sales were below $500,000.
Over 80% of the eastside home sales were below $750,000.
Twenty-seven home sales were below $250,000.
Thirty-six home sales out of the 1119 were priced above $1,500,000.
Only 2% of the sales were above $2,000,000. Out of 1119 home sales, only 18 were priced above this $2,000,000 mark.
24% of eastside sales were short sales or bank owned properties, contrary to what many think. Most of the homes were sold by the actual home owner.
The sweet spot in Seattle-eastside real estate is between $250-500,000, with many of the homes priced between $350-500,000. Pre-2008, the sweet spot was the $500-750,000 price point.
Are Some Home Buyers More Demanding in Today's Real Estate Market?
Demanding home buyers? The New York Times had an article about home buyers being more demanding. I’ve seen it in action on Seattle’s eastside.
In recent home sales, not only do the buyers want a good price for the home, which is expected the way the real estate market has been, but some home buyers don’t want to buy a home unless the systems are all new or newer. Buyers have asked for a new furnace when the furnace worked fine and money to cover a future roof replacement that would not be happening in a condo complex for at least five years. Buyers are asking for replacements for systems that are older, but still working.

Are you seeing the same thing happen with some home buyers?
"Green" is Back on the Seattle-Eastside's Real Estate Map, May, 2010

Home Sales Activity for King and Snohomish Counties, May, 2010
During May “green” crept back into a number of Seattle areas. One large area on the eastside, Woodinville, Bothell, Kenmore, Duvall, and north Kirkland was “green,” back as a buyer’s market.
April was the first month in a very long time in which there was no ” green,” no buyers’ markets in almost all the Seattle-eastside areas. In April, the Seattle area real estate market was the strongest in years. This is most likely a direct result of the 2010 tax credit. Both buyers and sellers were rushing to buy and sell before the expiration of the credit.
May represented a lull in the Seattle real estate market. Was this a temporary lull or our new normal? The next several months will be good indicators, although summer tends to be a slower time every year in Seattle real estate. Home buyers and sellers are like everyone else. Seattleites play outside in summer. Of course, that’s providing the sun ever comes out this year!
The good real estate news is there are still great homes and condos out there to buy and interest rates are at historic lows. The loss of the tax credit may not make much of a difference when calculating the savings in monthly payments over time.

Interest Rates 6-2010
It may be the fall before we can determine the true pace of Seattle real estate. I’ll keep you posted.

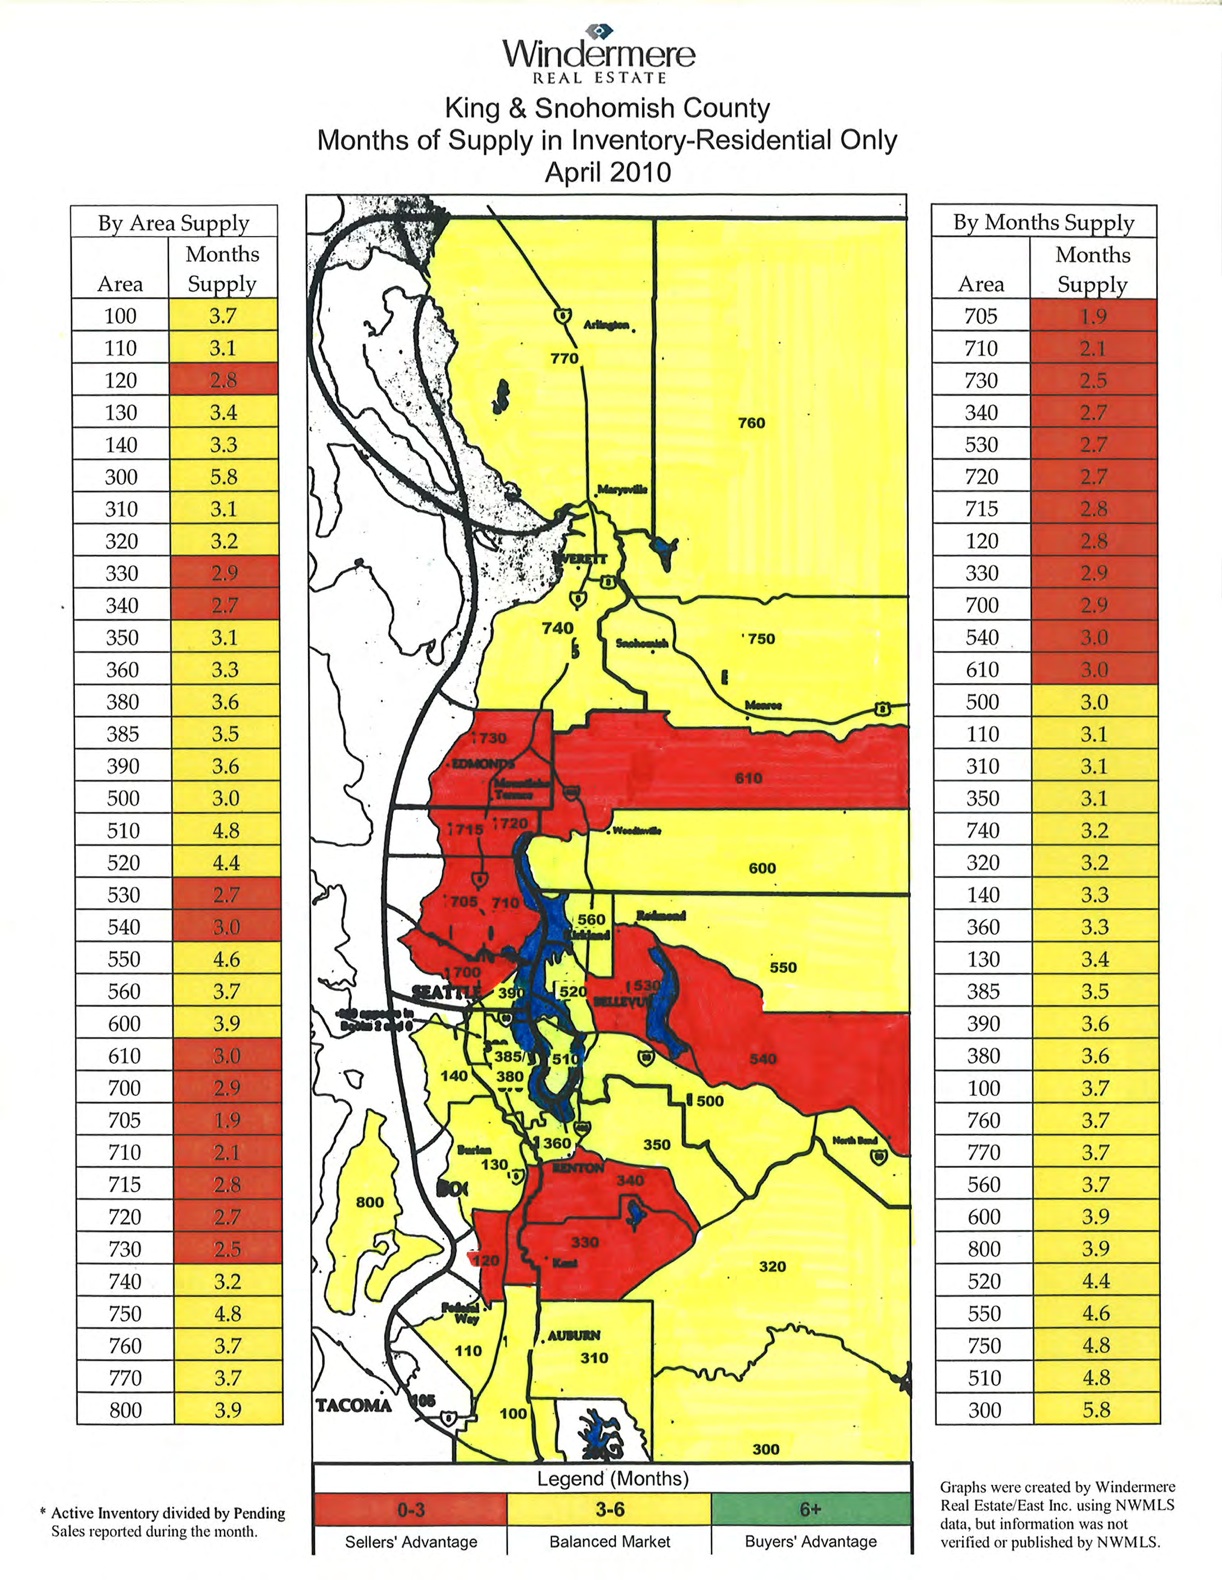
- King Snohomish Counties Real Estate Market 4-30-10
What do the numbers on the map mean?
The map is divided into the numbered areas as defined by our Northwest Multiple Listing Service (NWMLS). Downtown Bellevue is area 520 and East Bellevue is area 530, as an example.
What do the colors mean?
Red means it’s a sellers’ market, a sellers’ advantage.
Yellow means a balanced market between buyers and sellers.
Green means it’s a buyers’ market.
If you take each area as shown on the map and look to the area number on the side of the map, it will tell you how long it would take to sell every home currently for sale if no other home came up on the market in that area.
How Did May, 2010 Seattle-Eastside Real Estate Sales Stack Up in Your Neighborhood
[googlemaps http://maps.google.com/maps?source=s_q&hl=en&geocode=&q=Seattle-eastside&sll=47.709762,-122.011414&sspn=0.310487,0.911865&ie=UTF8&split=1&radius=21.22&rq=1&ev=zo&hq=Seattle-eastside&hnear=&ll=47.709762,-122.011414&spn=0.310487,0.911865&t=h&output=embed&w=425&h=350]
How did May, 2009 stack up to May, 2010 in your neighborhood?
(Click on the cities below to see real estate trends for the past 5 years. You’ll find the median pricing for each city and whether the number of homes for sale and the number of sales went up or down. The odds of selling a home in each area is a result of the number of homes for sale divided by the actual number of home sales.)
The plateau: Sammamish, Issaquah, North Bend, and Fall City
The odds of selling a home were 20.5%.
Median sales price increased from $524,950 to $559,880.
The number of homes for sale dropped by 20% and sales were up by 6% from last year.
The odds of selling a home were 18%.
Median sales price dropped from $515,000 to $480,000.
The number of homes for sale dropped by 10% and sales were down by 7.5%.
The odds of selling a home were 16%.
Median price increased to $624,975 from $619,000.
The number of homes for sale dropped by 19% and sales were down by 6%.
Woodinville/Bothell/Kenmore/Duvall/North Kirkland
The odds of selling a home were 12%.
Median price decreased to $451,126 from $459,500.
The number of homes for sale declined by 8% and sales were down by 22%.
The odds of selling a home were 15%.
Median price decreased to $599,000 from $599,950.
The number of homes for sale declined by 25% and sales were up by 3%.
The odds of selling a home were 19%.
Median pricing was up from $1,097,000 to $1,280,000.
The number of homes for sale decreased by 23% and sales decreased by 12.5%.
Redmond/Education Hill/ Carnation
The odds of selling a home were 15.5%
Median pricing decreased from $569,895 to $519,950.
The number of homes for sale decreased by 17% and sales decreased by 18%.
When compared to May, 2009, only one area of Seattle’s eastside showed an increase in median prices. West Bellevue had the highest with a 17% increase in sales prices. Last month the area had the most significant decrease in pricing. The return of some strength to the high end market is a good sign. The high end was the least affected by the tax credit.
Most other Seattle-eastside neighborhoods experienced a reduction in sales prices.
Home sales also took a dip in most areas of the eastside. Two areas, Kirkland and the plateau area of Sammamish, had increased home sales, but only in the single digits.
Seventeen percent less homes are for sale on the eastside this year than last year.
Has your area seen a drop in home sales since the expiration of the tax credit?
What Were The Odds of Selling Your Seattle-Eastside Home in May, 2010?

Seattle-Eastside Real Estate Sales, May 2010
The odds of selling a home on the Eastside in May, 2010 ranged from a low of 12% to a high of 20%, with an average 16.5% absorption rate. Contrast this with April, 2010 odds with a low of 20% to a high of 35%, averaging a 27% absorption rate.
May’s numbers look more like May of last year than they do of April of this year. This month may mark the back to reality of Seattle-eastside real estate or maybe not. We’ll need to see how the rest of the year plays out as so many people rushed to buy and sell before the end of the tax credit. There are still buyers who want to buy and the sellers who need to sell, although this may be a time of adjustment.
(The absorption rate is the number of homes for sale in any given month divided by the actual number of homes sold that month.)
May, 2010 3209 homes for sale 529 homes sold 16.5% odds of selling.
April, 2010 3084 homes for sale 770 (was 847) homes sold 25%(was 27.5%) odds of selling.*
May, 2009 3841 homes for sale 547 homes sold 14% odds of selling.
*Adjusted from previous month’s numbers to reflect the actual number of homes sold and closed. Each month some sales fall apart and don’t close. A lower number of home sales may be reported at a later date to show the actual number of sales that did close.
_____________________________________________________________
May, 2009 Seattle-Eastside real estate market compared to May, 2010:
- We are back to reality with Seattle-Eastside home sales. The tax stimulus pushed both home buyers and sellers to act more quickly this year, so the high number of home sales in April may have contributed to the drop in number of eastside home sales in May.
- The end of the tax stimulus had a greater impact on lower priced homes compared to higher priced homes.
- The average list price of properties that are pending went from $512,060 to $646,545. This is an unprecedented change month to month.
- As of this past week, there are 13,615 King County homes (houses and condos) for sale.
- The median price was down by .9%, an insignificant drop.
- Home sales on Seattle’s Eastside: down 7% The first down month in 2010.
- Number of homes for sale on Seattle’s Eastside: down 17%
Best odds of selling: Sammamish plateau areas of Sammamish, Issaquah, North Bend, and Fall City with the best odds of selling as 20.5% of the Sammamish homes got offers.
Worst odds of selling: Woodinville, Bothell, Kenmore, Duvall, and North Kirkland with 12% of the homes getting accepted offers.
Biggest increase in sales from last year: A small 6% increase in Sammamish home sales was the highest increase in Seattle-eastside real estate sales. Quite a contrast to the double and triple digit increases we’ve seen the last few months. As an example, there was 102% increase in the number of Kirkland homes sold in April, 2010 when compared to April, 2009.
Smallest increase in sales from last year: Kirkland home sales increased by 3%
Decline in real estate sales from last year: There was a decline in 5 out of the 7 Seattle-eastside areas, unlike the last few months when every eastside neighborhood experienced an increase in home sales. Redmond and Carnation had the largest decline in home sales with an 18% decline in the number of homes sold.
The peak of homes for sale in 2008: July, 4370 homes.
The peak of homes for sale in 2009: June, 3859 homes.
The number of eastside homes for sale at the start of 2010: 2584 homes
The number of eastside homes for sale now: 3209 homes.
Rate of home sales that failed and did not close: 10%
Seattle Eastside real estate tends to slow down a bit when the sun comes out, which hopefully is any day now! The number of home sales could remain on the lower side in the near future for two reasons. One is the slow down after the tax credit rush which we are now seeing and the upcoming (think positively) sunny weather and summer vacations. People in Seattle like to play outside in the sun. There are a number of people who are “gearing up” to make a move, so we may see stronger eastside real estate sales when summer comes to an end.
Ironically, when people ask me when is the best time time to sell a home, I tell them spring and fall are usually the best times. However, homes sell each month and the ones that show the best and are priced competitively will be the ones to get the offer.
Make More Money Selling Your Home, Part 6, Replace Your Carpet
Mr and Mrs. Home Seller ask: “Why don’t we let the buyers pick out the new carpet? We don’t know what color they may want.”

New carpeting Creates a Fresh, Clean Look
This is one of the most common sentiments I’ve heard over the years from home sellers. Sellers often think it’s best to leave the old carpet, offer a carpet allowance if needed, and let the buyer choose their own carpet.
Is this right? Do buyers want to choose their own carpet?
NO. Not in the Seattle-Eastside real estate market. Buyers DO NOT want to choose, pay or replace carpet when buying a new home. In this area, Seattle’s eastside cities of Bellevue, Redmond, Kirkland, and Issaquah, etc., buyers want to buy a home that’s move-in ready.
On Seattle’s eastside, the typical buyer is a very busy person(s) who may work a lot of hours. Most buyers aren’t looking to do structural or cosmetic updates to a home. They don’t have the time or the inclination. They want to move in and continue on with their lives with the least amount of disruption. They don’t want to be replacing carpet. Besides, there are lots of Seattle-eastside homes to choose from and many of the other homes have been updated and are ready to go.
Most home sellers don’t want to replace carpet either, but think about it. The buyers don’t have to replace your carpet because they don’t have to buy your home. They have other homes to buy. However, as the seller, you have only one home to sell and so you’ve got to do it. Remember, if you feel like you don’t want to replace the carpet, the buyer probably feels the same way. The catch is, they don’t have to do it, they can buy another home.
So if you want to get an offer to buy your home and make the most money while selling your home, replace your carpet if it’s worn, discolored, has stains, you name it. Make sure it looks fresh and clean, otherwise it will cost you money in the sales price for your home and it could even cost you getting a buyer.
Should you spend a lot for expensive carpet? Absolutely not. You should put in a good grade of carpet, but one that is similar to what builders install in new construction. Make sure you pick a neutral color and install a good 8 lb. pad underneath the rug. A thin pad with new carpet won’t work. It’s easy to tell that either the carpet or the pad are thin the minute you step on it. It feels like you’re on cement.
Looking for some other tips to get the most money when selling your home? Read Parts 1-5, planting some “green,” when to set the sales price, yard clean up, dressing up a front door, and replacing moldings and doors. Pick what your home needs to get it “dressed up” to sell in the competitive Seattle real estate market.
There's No Green on The Seattle-Eastside Real Estate Map April, 2010
King Snohomish Counties Real Estate Market 4-30-10
What do the numbers on the map mean?
The map is divided into the numbered areas as defined by our Northwest Multiple Listing Service (NWMLS). Downtown Bellevue is area 520 and East Bellevue is area 530, as an example.
What do the colors mean?
Red means it’s a sellers’ market, a sellers’ advantage.
Yellow means a balanced market between buyers and sellers.
Green means it’s a buyers’ market.
If you take each area as shown on the map and look to the area number on the side of the map, it will tell you how long it would take to sell every home currently for sale if no other home came up on the market in that area.
The first time in years, literally, that there were no buyers’ markets on the King-Snohomish County, Washington map of real estate. Last month, there was one area, Vashon Island, which is now coming up as a balanced market.
The two hottest selling markets on the eastside in April, 2010?
The first is Redmond, near Microsoft, East Bellevue and the second is the plateau area which includes Sammamish, parts of Issaquah, North Bend, and Fall City.
