Bellevue Real EstateBellevue, WAFor BuyersFor HomeownersFor SellersKing County Real EstateKing County, WAKirklandReal EstateRedmondSammamish, WASammamish, WA Real EstateSeattle real estateWA real estateWindermere Real EstateWoodinville, WAWoodinville, WA Real Estate October 15, 2010

It Was Mostly a Buyers' Market on Seattle's Eastside in September, 2010


Real Estate Map for Seattle Area

King & Snohomish County Reat Estate, 9-30-10


Sellers’ markets on this map are in red and there is no red in Seattle or on Seattle’s eastside. Most of the neighborhoods are buyers’ markets, which are in green.  Only two areas, Bellevue and Redmond near Microsoft, which is area 530, and area 600, which is Woodinville, Bothell, Duvall, are balanced markets.  Last month, Bellevue and Redmond near Microsoft and Kirkland were the balanced markets.

A balanced market is when homes on average are selling between 3-6 months, which means there was a level playing field between buyers and sellers in those areas for that particular month.  A buyers’ market means the homes on average are taking longer than 6 months to sell and a sellers’ market means the homes take less than 3 months to sell.

A real estate market is labeled a buyer or sellers’ market depending on the homes that actually sold that particular month.  Since the sales can vary each month, the type of real estate market can very easily change, going back and forth between a buyer or seller advantage.  Don’t count on the market staying the same each month in any area.

Remember, too, an area may be a buyers’ market and there can still be a terrific home that’s the best of the competition and sells with multiple offers or for full price.  It’s always important to understand how much competition a particular home has and how well priced it is when compared to the competition.  So look at the overall real estate market, look at the market in your neighborhood, and then look at the specific home and how well it’s priced for that market.  Weigh all of this information when making a buying decision or a decision as to how to price your home.

What do the numbers on the map mean?

The map is divided into the numbered areas as defined by our Northwest Multiple Listing Service (NWMLS).  Downtown Bellevue is area 520 and East Bellevue is area 530, as an example.

What do the colors mean?

Red means it’s a sellers’ market, a sellers’ advantage.

Yellow means a balanced market between buyers and sellers.

Green means it’s a buyers’ market.

If you take each area as shown on the map and look to the area number on the side of the map, it will tell you how long it would take to sell every home currently for sale if no other home came up on the market in that area.

Bellevue Real EstateBellevue, WAFor BuyersFor SellersIssaquah Real EstateIssaquah, WAKing County Real EstateKing County, WAKirklandMarket StatisticsReal EstateRedmondSammamish, WA Real EstateSeattle real estateWA real estateWindermere Real EstateWoodinville, WAWoodinville, WA Real Estate October 14, 2010

How Was The Seattle-Eastside Condo Market in September, 2010?


Condo Sales on Seattle's Eastside, September, 2010

Seattle Eastside Condo Sales September 2010


(The absorption rate, the percentage of condos selling, is the number of condos for sale in any given month divided by the actual number of condos sold that month.  So if the absorption rate or chance of selling is 10% that means out of 100 condos for sale, 10 received offers and sold.)

September, 2010        1448 condos for sale      155 condos sold                    11% odds of selling.

August, 2010               1499 condos for sale      140 (was 152) condos sold     9%  (was 10%)  odds of selling.*

September, 2010        1407  condos for sale     206 condos  sold                   12% odds of selling.

*Adjusted from previous month’s original numbers to reflect the actual number of condos sold and closed.  Some of the sales originally reported last month failed and did not close.   Some of the reasons sales fail are the buyer and seller don’t agree on the building inspection, the condo does not appraise for the sales price or the buyer’s financing does not come through.

The number of Seattle-eastside condo sales in September is very close to last year.  In fact, if you look at most of the months on the above chart, March and April stand out.  All the other months, except one, have fairly similar condo sales numbers.  March and April totals, which were so much higher than the other months, were because of tax credit.  Buyers rushed to beat the deadline of the tax credit during those months.  Ironically, that impacted May’s sales record.  It was the really low month of this year because so many of the buyers bought before May.

It’s too bad so many people rushed to buy then, because there is less competition among buyers and better interest rates.

As I mentioned last month, expect to see the number of condos for sale to keep dropping, which is a good thing for both buyers and sellers.  It will help to bring a little bit more balance to the market, although it will be a long time before there is a balanced market between buyers and sellers.

If you’re selling your condo, can you be one of the 11/100 who gets the offer?  Yes, if price and condition beat all of your competition.

What do you see happening with condo sales in your area?

Bellevue Real EstateBellevue, WAFor BuyersFor HomeownersFor SellersIssaquah Real EstateIssaquah, WAKing County Real EstateKing County, WAMarket StatisticsReal EstateRedmondSammamish, WASammamish, WA Real EstateSeattleSeattle real estateWA real estateWoodinville, WAWoodinville, WA Real Estate October 13, 2010

How Did September, 2010 Seattle-Eastside Real Estate Sales Do In Your Neighborhood?

[googlemaps http://maps.google.com/maps?source=s_q&hl=en&geocode=&q=Seattle-eastside&sll=47.709762,-122.011414&sspn=0.310487,0.911865&ie=UTF8&split=1&radius=21.22&rq=1&ev=zo&hq=Seattle-eastside&hnear=&ll=47.709762,-122.011414&spn=0.310487,0.911865&t=h&output=embed&w=425&h=350]

How did September, 2009 compare to September, 2010 in your neighborhood?

(Click on the cities below to see real estate trends for the past 5 years.  You’ll find the median pricing for each city and whether the number of homes for sale and the number of sales went up or down.  The odds of selling a home in each area is a result of the number of homes for sale divided by the actual number of home sales, so if 10 out of 100 homes sold, the odds of selling would be 10/100 or 10%)

The plateau:  Sammamish, Issaquah, North Bend, and Fall City

The odds of selling a home were 13%.

Median sales price increased from $493,995 $500,000.

The number of homes for sale increased by 15% and sales were down by 25% from last year.

West Redmond/East Bellevue

The odds of selling a home were 17%.

Median sales price decreased to $464,750 from $499,500.

The number of homes for sale was up by 15% and sales were down by 25%.

South Bellevue/Issaquah

The odds of selling a home were 13%.

Median price decreased to $520,000 from $564,900.

The number of homes for sale dropped by 8% and sales were down by 4%.

Woodinville/Bothell/Kenmore/Duvall/North Kirkland

The odds of selling a home were 14%.

Median price was down from $399,975 to $389,500.

The number of homes for sale declined by 6% and sales were down by 15%.

Kirkland

The odds of selling a home were 13%.

Median price increased to $599,000 from $549,950.

The number of homes for sale declined by 8% and sales were down by 17%.

West Bellevue

The odds of selling a home were 13%.

Median pricing was down from $1,012,000 to $899,000.

The number of homes for sale decreased by 15% and sales decreased by 30%. (Another big hit!)

Redmond/Education Hill/ Carnation

The odds of selling a home were 14.5 %

Median pricing increased from $449,950 to $499,925.

The number of homes for sale increased by 5% and sales decreased by 2%.

The real estate sales numbers are down on Seattle’s eastside, which is no big surprise to many of us.  However, again we see median pricing up in 3 out of 7 neighborhoods.  Don’t get too excited though.  The median pricing is based on the homes that sold that month, not on the trend for the whole year.  I can safely say median pricing is down since last year all over the eastside, even if a month or two shows an increase.  We have to look at the overall trend for the year.

Sales were down by a lot, 30% in West Bellevue.  In East Bellevue/Redmond near Microsoft and on the Sammamish plateau, sales were down by 25%.  These are big numbers.

The number of homes for sale on Seattle’s eastside is starting to head downward.  (This is a good thing.) There are 400 fewer homes on the market in King County than just a few weeks ago.  I expect to see that number continue to drop.

What real estate activity have you seen in your neighborhood?


Bellevue Real EstateBellevue, WAFor BuyersFor HomeownersFor SellersIssaquah Real EstateIssaquah, WAKing County Real EstateKing County, WAKirklandMarket StatisticsReal EstateRedmondSammamish, WASammamish, WA Real EstateSeattle real estateWA real estateWoodinville, WAWoodinville, WA Real Estate October 12, 2010

How Was The Seattle-Eastside Real Estate Market in September, 2010?


Seattle-eastside Home Sales Stats

Seattle-Eastside Real Estate Sales, September 2010


So how was the September real estate market on Seattle’s eastside?

The odds of selling a home on the Eastside in September ranged from 13% to 17%, with an average 14% absorption rate.*  Most home sellers on Seattle’s eastside had a 14/100 change of selling their home last month.  The absorption rates were pretty consistent throughout the whole eastside.

*(The absorption rate is the number of homes for sale in any given month divided by the actual number of homes sold that month.  If the absorption rate is 10%, then 10 out of 100 homes sold that month.)

September, 2010    3487 homes for sale     475 homes sold          14% odds of selling.

August, 2010           3492 homes for sale     473 (was 491) homes sold     13.5% (was 15%) odds of selling.*

September,  2009   3518 homes for sale     581  homes sold         19.5% odds of selling.

*(Some home sales fail because of the buyer financing or an inspection.  The number of sales is updated when we find out the actual number of homes that sold during that time.)

_____________________________________________________________

September, 2009 Seattle-Eastside real estate market compared to September, 2010:


  • The average  price of pending homes (recently sold homes) went from $532,922 to $521,576.  Two neighborhoods showed an increase in prices for the month.
  • As of this past week, there were 13,867 King County homes (houses and condos) for sale.
  • The number of homes sold on Seattle’s Eastside:  down 18% from last year.
  • Number of homes for sale on Seattle’s Eastside:  Almost 250 more homes for sale than last year.
  • The reality is the actual number of homes selling has not changed all that much, it’s the competition that has increased by a huge margin.  Since it is more competitive out there, the homes that are priced right and show well are the homes the buyers pick to buy.

Best odds of selling: Redmond, near Microsoft, and East Bellevue. 

Worst odds of selling: West Bellevue, although it’s within a hair of most all the other eastside neighborhoods.

Biggest increase in sales from last year: None, there was no increase in home sales from last year to this year in any of the eastside areas.

Smallest increase in sales from last year: No increases.

Decline in home sales from last year: There was a decline in 7 out of the 7 Seattle-eastside areas. West Bellevue had the largest decline in home sales with 30% decline in the number of homes sold.  The Sammamish plateau area and the Redmond/East Bellevue area around Microsoft both had 25% decline in home sales.

The peak of homes for sale in 2008: July,  4370 homes.

The peak of homes for sale in 2009: June,  3859 homes.

The number of eastside homes for sale at the start of 2010: 2584 homes

The number of eastside homes for sale now: 3487 homes.

For a picture of King County sales, check out The Seattle Times.

What are you seeing in your neighborhood?  Are some doing better than others?

Built Green and Sustainable LivingEnergy conservationEnergy IncentivesFor Homeowners October 11, 2010

I Gave A Friend Away to Save Money and Reduced My Carbon Footprint

He’s gone.  They carted him away today after our very long relationship, a longer one than I’ve had with my husband.  He’s always been a little chilly, in fact, downright cold. But he was faithful, always ready, and never needed any fixing.  He moved with me from an apartment to two homes, from the east to the west coast, never complaining.  We went through many a family dinner, holiday extravaganza and party over the years.  He’d always been responsible for the food.

He showed evidence of aging over the years, just like we all do. There were the spills that occasionally needed to be cleaned off him.  Some bumps and scratches were noticed here and there, but overall, he was a healthy specimen.  It’s been hard to let go of him because he’s been working so loyally all these years.

Deep down, I’ve known it’s time to let him go. How many times do we put off making changes in our lives?  How many times do we say we’ll deal with it tomorrow or think something is not a big deal?  I knew our relationship was costing me money.

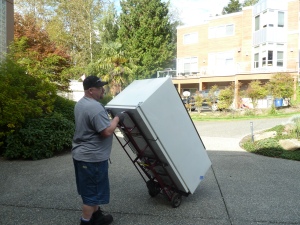
I made the phone call to end our relationship.  They came to get him on Friday afternoon.  He was ready and waiting for them to take him away. After so many years, it was over in a matter of minutes.  Out the door and up the driveway he went.

Refrigerator being recycled

Here’s what happened:

On Tuesday, I signed up online to have Puget Sound Energy come pick him, my refrigerator, up.  If you’re a Puget Sound Energy customer, they’ll remove your refrigerator and pay you $30 (as long as the money lasts and your refrigerator is in working order). The two men who came to pick the refrigerator up, said 85-90% of the refrigerator will be recycled and not end up in a landfill.  So he’ll be reused, not dumped.

According to Puget Sound Energy’s website:

Old fridges and freezers use up to four times the energy of newer models. That’s four times the electricity costs and four times the negative environmental impact.

The Puget Sound people left me with more information about the program:

  • PSE has picked up 15,000 refrigerators and freezers.
  • PSE customers will save over 18 million kilowatt hours of electricity.
  • Save over $1.6 million pounds of CO2 emissions.  The same as taking 1400 vehicles off the road.

Want more information about using energy wisely?  The PSE website has a lot of great tips.

I took a great class this week to learn more about sustainable living, “green” living as you will, so I’ll write about what I’ve learned.  I’ll also write about what I’m doing to make some important changes in the way I live.  My goal is to reduce my carbon footprint and save some money, too!

A hat tip to Marlow Harris for posting a link to the PSE energy program on Facebook.  By the way, check the site to find out all the details and any restrictions.

What are you doing to reduce your carbon footprint?

Built Green and Sustainable LivingEnergy conservationFor HomeownersReal Estatesustainable living October 5, 2010

I Need to Learn How to Reduce My Carbon Footprint

I have a big, fat carbon footprint! I’m surprised and I’m not happy.  I took a survey to determine my carbon footprint and found out that it takes over 30 acres to support my lifestyle. If everyone lived the way I did, it would take multiple planets to support all the people on earth!  Very humiliating and disappointing.

I recycle as much as I can. I recycle a lot, in fact. My recycle bin is overflowing every week and my trash barrel holds just a small bag.  I don’t eat much meat.  I prefer fish and chicken.  I don’t drive a lot, except for work. (Driving is a hazard of my profession.) I have many reusable bags.  I rarely use paper bags.  I unplug electrical appliances.  I use CFL’s. I turn my lights out regularly.

So where have I gone wrong?  Why wasn’t my carbon footprint score better? I have a few theories for things I can do better, but I plan to learn and do more.  Over the next few days, I’ll be attending a class put on by the Earth Advantage Institute from Portland, Oregon.  The class is Sustainable Training for Accredited Real Estate Professionals, S.T.A.R.  The group got off to a good start by sending out a list of all the class attendees hoping we would hook up to car pool.  Wouldn’t it be great if people and organizations did that for all their meetings, classes, etc.?  Such a simple idea, but one most of us don’t take time to consider.

I’ll share what I learn, because if I have a poor carbon footprint score, I imagine a lot of us do.  Stay tuned!  By the way, take the survey and see how you do.  You may be surprised.

FinancingFor BuyersReal EstateReal Estate News September 30, 2010

Is there a 3.8% Real Estate Sales Tax Coming? Yes, But Mostly No

A 3.8% Sales Tax when selling a home? My client had heard about this from a friend last week.  He emailed me the other to day ask if the health care bill included a 3.8% sales tax when selling a home.  I was pretty sure this was not exactly right, but thought I should check this out and clear the air.

Apparently, it’s a common question or misconception. Courtney Cooper Jacobs had been asked the same thing by one of her clients.  She did some research and linked to Matt Stigliano’s blog, which did a great explanation of the future tax with some real world examples.

Yes, Virginia there will be a new tax but only for a “chosen” few. But no, it’s not a sales tax on real estate.  It’s a Medicare tax and only applies to certain people and homes. Most home sellers will not pay any additional tax.  Those that pay are the fortunate people who are high earners and have also made a killing on the sale of their home.   And, if there is a tax that applies,  it will only be a small percentage of the sales price.

From Matt Stigliano’s blog:

The new Medicare tax on real estate sales is actually a tax on investment income for so-called “high earners.”

With that in mind, a 3.8% Medicare tax on the sales of a $400,000 home would be $15,200, which is a lot of money to pay in tax. This is where many people’s calculations have gone astray however, as the real estate “sales tax” is not on the entire amount of the sale. Instead it is on the amount of income that exceeds the capital gains threshold ($500,000 for married couples filing jointly, $250,000 for single filers).

The income requirements are clearly spelled out in order to define “high earners” – $250,000 for married couple filing jointly, $125,000 for couples filing separate returns, and $200,000 for everyone else. If your income is above these levels, you will be paying a new tax on investment income. If it falls below that, you will not be taxed.

This medicare tax does not go into effect until 2013.  So I hope this clears the air for you.  It’s really not as bad as may people have been lead to believe.

FinancingFor BuyersFor Homeowners September 28, 2010

Want to Save Money on Your Mortgage?

Save Money
Twenty percent of the country is having financial difficulties with job and home losses
, according to Greg Heberlein, the financial commentator at KPLU.  The news has been so focused on the difficult economic situation and in real estate on short sales, foreclosures, declining home values.

What about the other 80%? We often forget about what’s happening with the other 80% of the population.  These people need to think wisely and make some solid financial decisions. If you own a home, Greg Heberlein recommends making an additional mortgage payment each year. You can drastically cut down the time you’re paying your mortgage, PLUS save a lot of money. We’ve heard this before, but it hasn’t been mentioned in a long time.  It’s good financial advice.

Here’s a few key thoughts from his talk:

  • One payment a year can lower a 30 year fixed mortgage by as much as 8 years.
  • One payment a year can lower a 15 year fixed mortgage by almost 5 years.
  • Despite the tax deduction, you’re still better off being as debt-free as possible.
  • The last 3-6 years of a mortgage payment have such a small interest amount, it often doesn’t allow for a deduction anyway.
  • By being as debt-free as possible, it increases one’s cash flow.


FinancingFor BuyersReal Estate September 23, 2010

Should You Consider The FHA ARM Loan?

An FHA ARM loan?  With such great 30 year fixed rates?  In this day and age of great interest rates, few home buyers think of purchasing a home with an ARM (Adjustable Rate Mortgage) loan. Steve Tedrow of Windermere Mortgage Services talks about why he thinks the FHA ARM loan works for some buyers.

There is much negative publicity about ARM loans.  But, did you know that the FHA 5 year ARM has many advantages which could enable a buyer to buy more or save more in their monthly payment.  One of the  unique features to an FHA ARM is that the adjustment cap after the initial 5 year term is only 1%.  Compare a 5 year ARM at todays’s rate of 2.875% versus a 30 year fixed rate mortgage at 4%.  If you assume a worst case scenario, the average interest rate over 9 years is 3.99% on the ARM.   Many first time home buyers do not plan on staying in a property more than 5-6 years.  The FHA ARM could save them thousands of dollars over this time frame.

Maximum FHA ARM Loan increases over 9 years

Maximum Increase in FHA ARM interest Rates Over 9 Years

Or, it could allow them to purchase a more expensive property without increasing your monthly payment:

Example of increasing your purchasing power with FHA ARM

Increase Your Purchasing Power With FHA ARM

You can contact Steve or your loan officer to learn more abut FHA ARMs.

For BuyersFor HomeownersFor SellersHome maintenance tipsReal Estate September 22, 2010

Was your Home Built Before 1978? New Lead Paint Laws Take Effect October, 2010

I just recommended a new client’s deck be painted before her home goes on the market.  The was home built in the 1950’s and it reminded me about the new law regarding remodeling and painting homes built before 1978.  This new law will be going into effect on October !st.  Originally, the regulations were scheduled to become law back in the spring.  I wrote a post about it then, but since the law was postponed until October 1st,  here’s a reminder for those who own homes built before 1978.  I am copying the original blog post I wrote back in the spring:

Was your home built before 1978? If so, then if you do any painting or remodeling you or your contractor have to follow new federal guidelines for painting and renovating homes built before 1978. From The Wall Street Journal:

As of late last month, businesses that repair or renovate older buildings—specifically homes, schools and daycare centers built before the federal government banned the use of lead-based paint in housing in 1978—are required by the U.S. Environmental Protection Agency to adhere to strict lead-safe work practices. To comply with the new regulation, those working on older sites will need to invest in lead-testing kits, plastic sheeting, respirators, protective clothing and other lead-safety materials.

This also is straight from the EPA website.