For BuyersFor HomeownersFor SellersIssaquah Real EstateKing County, WAKirklandMarket StatisticsReal EstateRedmondSammamish, WASammamish, WA Real EstateWA real estateWoodinville, WAWoodinville, WA Real Estate September 17, 2010

What Were The Chances of Selling Your Seattle-Eastside Condo in August, 2010?

Condos Real Estate Sales on Seattle's eastside

Seattle Eastside Condo Sales, August 2010

(The absorption rate, the percentage of condos selling, is the number of condos for sale in any given month divided by the actual number of condos sold that month.  So if the absorption rate or chance of selling is 10% that means out of 100 condos for sale, 10 received offers and sold.)

August, 2010               1499 condos for sale      152 condos sold                    10% odds of selling.

July, 2010                    1552 condos for sale      128 (was 144) condos sold     8% (was 9%)  odds of selling.*

August 2009               1429  condos for sale     168 condos  sold                   12% odds of selling.

*Adjusted from previous month’s original numbers to reflect the actual number of condos sold and closed.  Some of the sales originally reported last month failed and did not close.   Some of the reasons sales fail are the buyer and seller don’t agree on the building inspection, the condo does not appraise for the sales price or the buyer’s financing does not come through.

Sales of Seattle-eastside condos in August of this year are very close to last August’s sales activity.

There was a significant drop in the number of Seattle-eastside condos for sale in August from July’s high of 1552.  I expect more condos to come off the market as we head towards fall and winter.

What do you see happening with condo sales in your area?

Bellevue Real EstateBellevue, WAFor BuyersFor HomeownersFor SellersIssaquah Real EstateIssaquah, WAKing County Real EstateKing County, WAKirklandMarket StatisticsReal EstateRedmondSammamish, WASammamish, WA Real EstateWA real estateWoodinville, WAWoodinville, WA Real Estate September 16, 2010

What Were The Odds of Selling Your Seattle-Eastside Home in August, 2010?

Real Estate Activity on Seattle's eastside, August, 2010

Seattle-Eastside Real Estate, August 2010

The odds of selling a home on the Eastside in August, 2010 ranged from a low of 6% to a high of 21%, with an average 14% absorption rate.  This month, West Bellevue is in the single digits,  at 6%.

The real estate activity in the summer months has turned out to be very different than the activity in the spring.  Clearly, both buyers and sellers rushed to buy and sell before the tax credit expired.  We have a buyers’ market for most of the eastside again, which means buyers can choose from a variety of nice homes and probably not find other buyers competing with them.

(The absorption rate is the number of homes for sale in any given month divided by the actual number of homes sold that month.)

August, 2010          3492 homes for sale     491 homes sold            15% odds of selling.

July, 2010               3468 homes for sale     470 homes sold           13.5% odds of selling.

August,  2009        3604 homes for sale     580  homes sold         16% odds of selling.

_____________________________________________________________

August, 2009 Seattle-Eastside real estate market compared to August, 2010:

  • The average  price of pending homes (recently sold homes) went from $543,639 to $532,692.  Some neighborhoods showed an increase in prices for the month.
  • As of this past week, there were 14,333 King County homes (houses and condos) for sale, less than late July’s high of 14,639.
  • Home sales on Seattle’s Eastside:   down 2.5% from last August’s number.
  • Number of homes for sale on Seattle’s Eastside:  down 3% from last year.
  • The reality is some homes are selling well, but it is only those homes priced well and showing well.

Best odds of selling: Redmond, near Microsoft, and East Bellevue. 

Worst odds of selling: West Bellevue

Biggest increase in sales from last year: An 8% increase in home sales in Redmond, near Microsoft and East Bellevue.

Smallest increase in sales from last year: Same as above.  This area had the only increase in Seattle-eastside home sales in August.

Decline in real estate sales from last year: There was a decline in 6 out of the 7 Seattle-eastside areas. West Bellevue had the largest decline in home sales with 65% decline in the number of homes sold.

The peak of homes for sale in 2008: July,  4370 homes.

The peak of homes for sale in 2009: June,  3859 homes.

The number of eastside homes for sale at the start of 2010: 2584 homes

The number of eastside homes for sale now: 3492 homes.

For a picture of King County sales, check out The Seattle Times.

Bellevue Real EstateBellevue, WAFor BuyersFor HomeownersFor SellersIssaquah Real EstateIssaquah, WAJust for FunKing County, WAKirklandMarket StatisticsReal EstateRedmondSammamish, WASammamish, WA Real EstateWA real estateWoodinville, WAWoodinville, WA Real Estate September 15, 2010

How Did August, 2010 Seattle-Eastside Real Estate Sales Stack Up In Your Neighborhood?

[googlemaps http://maps.google.com/maps?source=s_q&hl=en&geocode=&q=Seattle-eastside&sll=47.709762,-122.011414&sspn=0.310487,0.911865&ie=UTF8&split=1&radius=21.22&rq=1&ev=zo&hq=Seattle-eastside&hnear=&ll=47.709762,-122.011414&spn=0.310487,0.911865&t=h&output=embed&w=425&h=350]

How did August, 2009 stack up to August, 2010 in your neighborhood?

(Click on the cities below to see real estate trends for the past 5 years.  You’ll find the median pricing for each city and whether the number of homes for sale and the number of sales went up or down.  The odds of selling a home in each area is a result of the number of homes for sale divided by the actual number of home sales.)

The plateau:  Sammamish, Issaquah, North Bend, and Fall City

The odds of selling a home were 16%.

Median sales price decreased from $515,000 $479,895.

The number of homes for sale increased by 9% and sales were down by 17% from last year.

West Redmond/East Bellevue

The odds of selling a home were 21%.

Median sales price increased to $494,900 from $475,000.

The number of homes for sale were up by 4% and sales were UP by 8%.

South Bellevue/Issaquah

The odds of selling a home were 14%.

Median price increased to $550,000 from $499,500.

The number of homes for sale dropped by 13% and sales were down by 26%.

Woodinville/Bothell/Kenmore/Duvall/North Kirkland

The odds of selling a home were 13%.

Median price was down from $425,000 to $415,000.

The number of homes for sale declined by 2% and sales were down by 27%.

Kirkland

The odds of selling a home were 14%.

Median price increased to $641,000 from $581,919.

The number of homes for sale declined by 13% and sales were down by 27%.

West Bellevue

The odds of selling a home were 6%.

Median pricing was down from $899,475 to $869,000.

The number of homes for sale decreased by 16% and sales decreased by 65%. (Ouch!)

Redmond/Education Hill/ Carnation

The odds of selling a home were 15%

Median pricing increased from $542,250 to $549,950.

The number of homes for sale increased by 12% and sales decreased by 10%.

Real estate sales numbers are down on Seattle’s eastside, with the exception of one area.  The East Bellevue and Redmond area near Microsoft showed a slight increase in the number of homes sold.  This area was also the only area to show an increase in median price, number of homes on the market (not so good), and number of homes sold.  However, median pricing was up in 3 other areas, South Bellevue and Issaquah,  Kirkland, and Redmond and Carnation.

The number of homes for sale on Seattle’s eastside is the highest for this year, but should be experiencing a downward swing as we head into fall. Right now, though, there are a lot of choices out there and not as many buyers to compete with.  Good buys are out there if you take your time and check out the homes for sale.

What real estate activity have you seen in your neighborhood?


Bellevue Real EstateBellevue, WAFor BuyersFor HomeownersFor SellersIssaquah Real EstateIssaquah, WAKing County Real EstateKing County, WAKirklandMarket StatisticsReal EstateRedmondSammamish, WASammamish, WA Real EstateWA real estateWoodinville, WAWoodinville, WA Real Estate September 15, 2010

Seattle-Eastside Real Estate is Mostly Green, A Buyers' Market

Real Estate in Snohomish and King County 8-31-10

King & Snohomish County Real Estate Activity 8-31-10

The Seattle-eastside has flipped back almost completely to a buyers’ market.   Two areas, Redmond and East Bellevue near Microsoft and Kirkland, were more balanced real estate markets, with the market time to sell a home falling between 3 to 6 months.   If you check out what the colors represent below, you can see how much of King County real estate is in the buyers’ camp right now.  With today’s low interest rates and the ability to negotiate strongly because of this market trend, it’s probably a better time to buy a home now than when everyone was rushing to beat the expiration of the tax credit.   The savings  would be spread out over a longer time period, but would be worth far more than the one time $8000 tax credit.  If you do decide to buy, remember to look for a home you can grow in that’s close to transportation, shopping, schools, and jobs.  A home that meets these criteria will hold its value better.

What do the numbers on the map mean?

The map is divided into the numbered areas as defined by our Northwest Multiple Listing Service (NWMLS).  Downtown Bellevue is area 520 and East Bellevue is area 530, as an example.

What do the colors mean?

Red means it’s a sellers’ market, a sellers’ advantage.

Yellow means a balanced market between buyers and sellers.

Green means it’s a buyers’ market.

If you take each area as shown on the map and look to the area number on the side of the map, it will tell you how long it would take to sell every home currently for sale if no other home came up on the market in that area.

Real EstateReal Estate Marketing September 13, 2010

I'm Looking for a Tech Savvy Realtor in South Carolina

I’m looking for a Realtor in South Carolina, the Greer/Greenville area, to be exact. My mother-in-law is moving and I need a Realtor to sell her home.

Last week, I contacted a Realtor from a Realtor network I belong to, Certified Residential Specialists. When referrals are made through the CRS network, they are by phone or email, since the referral is to an area outside of Seattle.  Rarely, do we meet the other agents.  I’ve made many referrals over the years and had good luck as the agents with the CRS designation.  They are long time agents who have had additional training and sell a certain numbers of homes each year, which means they’re experienced.

Since I was in South Carolina, I asked that this agent bring market statistics and her marketing plan to our meeting.  The agent came armed with 3 pieces of paper, one was a chart showing me her company sold the most homes in the area, and the other two had brief, very brief, information about the sales activity of the homes in the area.  Statistics? None.  Marketing plan? Zip.  Market analysis?  Nada

I asked her about her marketing plan and heard newspaper and real estate magazine advertising.  I told her to  spend her money on the internet and professional marketing, including professional photos.  No response to the professional photography.    I did hear the usual, though, the listing would be on the company website, but I did not get much more.

I asked that she send me the complete listing information and photos of each of the homes included in her short list of homes. She assured me she would.  Since it’s been two weeks since I met her, I doubt I will be getting that information. So she’s out.

We then contacted a personal referral who is a Realtor and also a CRS.  However, she is having some surgery in the next few weeks so is not taking on any new business.  We’re going to try another Realtor from a second personal referral next.

I turned to the internet. I’ve been online checking the local agents’ presence on the internet.  I’m looking for how the agents market homes.   I don’t bother to check the listings and agents who don’t use multiple photos when marketing a property.  However, I’m finding that with multiple photos, most are just plain awful.  Photos are dark, sometimes showing too much clutter, and don’t show the full room.  Finding the agent who uses professional photos might be like finding that one in a million.

Since I belong to some real estate networks on LinkedIn.com, that’s my next stop.

Here’s what I’m looking for when I’m hiring a Realtor:

  • Someone who knows the market and has statistics to back their information.
  • Someone who completes a professional market analysis and gives me realistic information on pricing.
  • A strong internet presence on multiple websites: A company website, Realtor.com, google, Zillow, Propsmart, Craig’s List, Oodle, etc.  Dedicated website for the home.
  • Video or tour of the home.
  • Photos, video, or tours of the local sites and the town.
  • Homes that are marketed when looking terrific, decluttered and staged
  • Professional photography
  • Nice property brochures with color photos
  • Open houses, only if they work in the area
  • Other creative marketing ideas
  • Communicate with me on a weekly basis.  I’d like an update on showings and the local real estate market.  I’d like to know if the competition has changed.  Has a competing home come on the market, reduced its price or sold?

This is the very level of service my mother-in-law should be getting.

Does anyone know a good Realtor in that area who can provide this service?  Any ideas on how to find someone?

For BuyersFor SellersReal EstateReal Estate Opinion September 9, 2010

Rethink The American Dream of Home Ownership Or Abandon It?

Give up on buying a home, The American Dream or refocus how you think about the American Dream?  Which is it? Recently, two articles appeared voicing opinions on the topic.  One article, in “Time” magazine, thought home buying was something many people need to reconsider.

Whereas an article in The New York Times written by Karl Case, one half of the famous Case-Shiller index and a Wellesley college economics professor, had a different perspective.  Professor Case says” The American Dream” should have a different focus. Buying a home is more like what it used to be, before homes began appreciating at dizzying rates.  Mr. Case believes there are still benefits to buying a home, but we need to change our expectations.  The “Times” questioned whether many should consider buying a home at all.

Some highlights from Karl Case’s article in The New York Times, “A Dream House After All:”

But for people with a more realistic version of the American dream, buying a house now can make a lot of sense. Think of it as an investment. The return or yield on that investment comes in two forms. First, it provides what is called “net imputed rent from owner-occupied housing.” You live in the house and so it provides you with a real flow of valuable services. This part of the yield is counted as part of national income by the Commerce Department. It is the equivalent of about a 6 percent return on your investment after maintenance and repair, and it is constant over time in real terms. Consider it this way: when Enron went belly up, shareholders ended up with nothing, but when the housing market drops, homeowners still have a house. And this benefit is tax-free.

The second part of the yield on investment in a house is the capital gain you receive if it appreciates and you sell the house. Gains are excluded from taxation if the property is a primary residence and the gain is less than $250,000 for a single filer or $500,000 for a married couple filing jointly.

You can deduct the interest you pay on the mortgage. Interest rates are about as low as they can get. And, don’t forget, home prices are down by 30 percent on average from the peak.

But housing has perhaps never been a better bargain, and sooner or later buyers will regain faith, inventories will shrink to reasonable levels, prices will rise and we’ll even start building again. The American dream is not dead — it’s just taking a well-deserved rest.

From Barbara Kiviat in Time magazine:

Many argue that home ownership should not be a goal pursued at all costs.

One major trade-off (with home ownership): mobility.  Being free to move around the country easily means that people can go where the jobs are.

The inflexibility that pervasive home ownership brings to labor markets has a cost.

But if there ever were a time to start weaning America off the idea that home ownership cures all our ills, now-after the worst housing crash in 75 years–would be it.

Who do you think is right or do both perspectives have some merit?  What do you think?

For BuyersFor HomeownersFor SellersHome maintenance tipsReal Estatesustainable living August 31, 2010

Don't Spend Money Greening Your Home Until…..

Are you feeling bombarded about “greening your home?‘  There’s so much stuff out there to absorb.  There are articles flying around about all the good “green” things to do.  Don’t get me wrong, I think reducing our carbon footprint,  going green, and hopefully, saving money are all important.

But, I just recently came across two articles that look at the costs of going” green” more closely.  Just because something is “green” doesn’t mean it truly reduces our carbon footprint or helps you to  save you money. One of the biggest offenders is bamboo flooring.  Since most bamboo is sourced in the Far East, the cost and impact on our carbon footprint for transporting bamboo may outweigh the fact that it’s a renewable resource.

During these crazy times it’s important to analyze how you spend your money on your home.  It’s important to think about the payback to you and the environment, in addition to the payback for when you might sell, even if selling your home is in the future. Going “green” is important to consider, but according to some, there are different ways to handle going green.

Two recent posts on different blogs talked about this very issue.  The Bigger Pockets blog listed 7 green items that could be a waste of money. I’m not sure I agree with all that is said.  For example, CLF’s, Compact Fluorescent Bulbs are more expensive than standard light bulbs, but they are a fairly inexpensive way to reduce our carbon footprint.  Sure they are more expensive than standard light bulbs and may become cheaper, but it’s important to start now and with CFL’s, it is a great place to start. From the EnergyStar website:

If every American home replaced just one light with a light that’s earned the ENERGY STAR, we would save enough energy to light 3 million homes for a year, save about $600 million in annual energy costs, and prevent 9 billion pounds of greenhouse gas emissions per year, equivalent to those from about 800,000 cars.

CFL's

Other things, such as location, factor into making a “green” decision. Bigger Pockets felt solar panels were not efficient enough yet to warrant the cost.  If you live in Seattle, it probably isn’t cost effective to install solar panels, especially with all the gray 65 degree days we’ve had this summer!  However, in Southern California it makes perfect sense.  I have a friend who installed solar panels and is receiving a substantial rebate for the first five years, plus a check from the utility company for helping to supply power back to the grid.  The payback for these people will be 5-7 years.  Not a bad return for a fairly expensive item.  But these folks have no plans to move, so the investment should more than pay for itself over the years.

Worldchanging tackles this same subject with a video of how to “green” a new construction home and other thoughts about how to reduce our carbon footprint. The post mentions a book by Eric Corey Freed and Kevin Daum entitled “Green Sense for the Home: Rating the Real Payoff from 50 Green Home Projects.”  The book is divided into three handy sections.  The first covers things that can be done now, like using CFL’s or insulating a hot water tank, to more expensive changes like adding solar power and new windows, to building a “green” new home.

The bottom line is everyone should be thinking about making changes, both big and small to save energy and money.  Some things work better for some people, homes, and locations than other “green” changes.  It is important to decide what works for you.  Do the research and make good decisions to maximize your dollar and to save energy.

What ways do you find to save energy and reduce your carbon footprint?  If you’ve got some “green” tips, ideas, etc., please do share.

ArchitectureBoomer issuesFor BuyersFor HomeownersReal Estate August 26, 2010

Cool Universal Design Could Save Home Buyers Money In The Long Run

Let’s face it, buying a home is an expensive prop0sition. There are different ways to try to save some money when buying a home.  One of the issues I see is home buyers not thinking of the future when buying a home. Home buyers don’t think about how a home could save them money over time. Home buyers want a “deal” when first buying a home, which is not surprising, but they often don’t think about how well a home could work for them.  There are a few different ways to think about how a home could be more cost effective over time.

For example, most people don’t think about the floor plan or how easy it is to live in a home.  Think of buying a home that’s a great deal, but has 4 levels, meaning a lot of running up and down stairs.  This style of home is great, but can get tiring, literally and physically.  It gets old after awhile when you have to cart groceries and laundry up and down stairs.  Most home buyers don’t think about a floor plan that’s easy to live with over many years.  But there are floor plans out there that work for a lot of people and a lot of lifestyles.

Enter “Aging In Place.”  The name suggests we’re talking about older people who want to stay in their homes.  But “Aging in Place”  has another term associated with it, Universal Design, design that works for everyone, young and old alike.  The teen who breaks a leg playing soccer or the Mom who is navigating the front doorway into a home with a baby stroller and packages are all people who benefit from “universal design,” design for everyone.

Most people think aging in place or universal design has too many restrictions to be attractive to multi-generations.  This is not true, if a home is designed and done right.  The Aging Well Consortium blog has terrific photos of a variety of homes with universal design elements.  The design would easily appeal to most buyers who live on Seattle’s eastside.  Plus if universal design features are incorporated into a home when it’s built, it’s not any more expensive to build.

Kitchen with Universal Design Features

Gourmet Kitchen with Wider Passageway

Maybe one way to save money over time when buying a home is to look at a home as truly a long term investment, a home that works for you no matter what may change in your life. Few home buyers ever do this.  Moving can be expensive when you’re selling a home and buying a new home because you no longer can stay in your home.  Think about it.

What do you think?

(Photos from  Zai architect Emory Baldwin’s home.)

Bellevue, WA August 20, 2010

There's A Lot of Green Close to Downtown Bellevue WA

Bellevue, WA is  “hot!”   The city is showing up on lists for the best schools, best places to live, and it’s a neighbor of Seattle, one of the top places in the next decade. It’s clear Bellevue has a lot to offer.  It’s got the economic vitality coupled with the beauty of lakes, the surrounding mountains, and wonderful green areas.  Here’s a video of a walk in The Mercer Slough, a green area smack dab in the middle of Bellevue.  (You can hear some road noise so you can tell you’re surrounded by greenery, but still in the city.  Mercer Slough also has guided walks available on Saturday afternoons.

So even though the city ends up on a lot of “top” lists, it’s great to see some green maintained in the heart of the city.  Take a walk down there and check it out.  It’s a beautiful piece of nature for all to enjoy.

[googlemaps http://maps.google.com/maps?f=q&source=s_q&hl=en&geocode=&q=Mercer+Slough,+Bellevue,+WA&sll=37.0625,-95.677068&sspn=23.761683,58.359375&ie=UTF8&hq=&hnear=Mercer+Slough&ll=47.586255,-122.18688&spn=0.009841,0.028496&t=h&z=14&output=embed&w=425&h=350]

Bellevue Real EstateBellevue, WAFor BuyersFor SellersIssaquah Real EstateIssaquah, WAKing County Real EstateKing County, WAKirklandReal EstateRedmondSammamish, WASammamish, WA Real EstateSeattle real estateWindermere Real EstateWoodinville, WAWoodinville, WA Real Estate August 13, 2010

There Were No Sellers Markets in the Seattle Area in July, 2010

Real Estate Activity in King And Snohomish County 7-10

King & Snohomish County Real Estate, 7-31-10

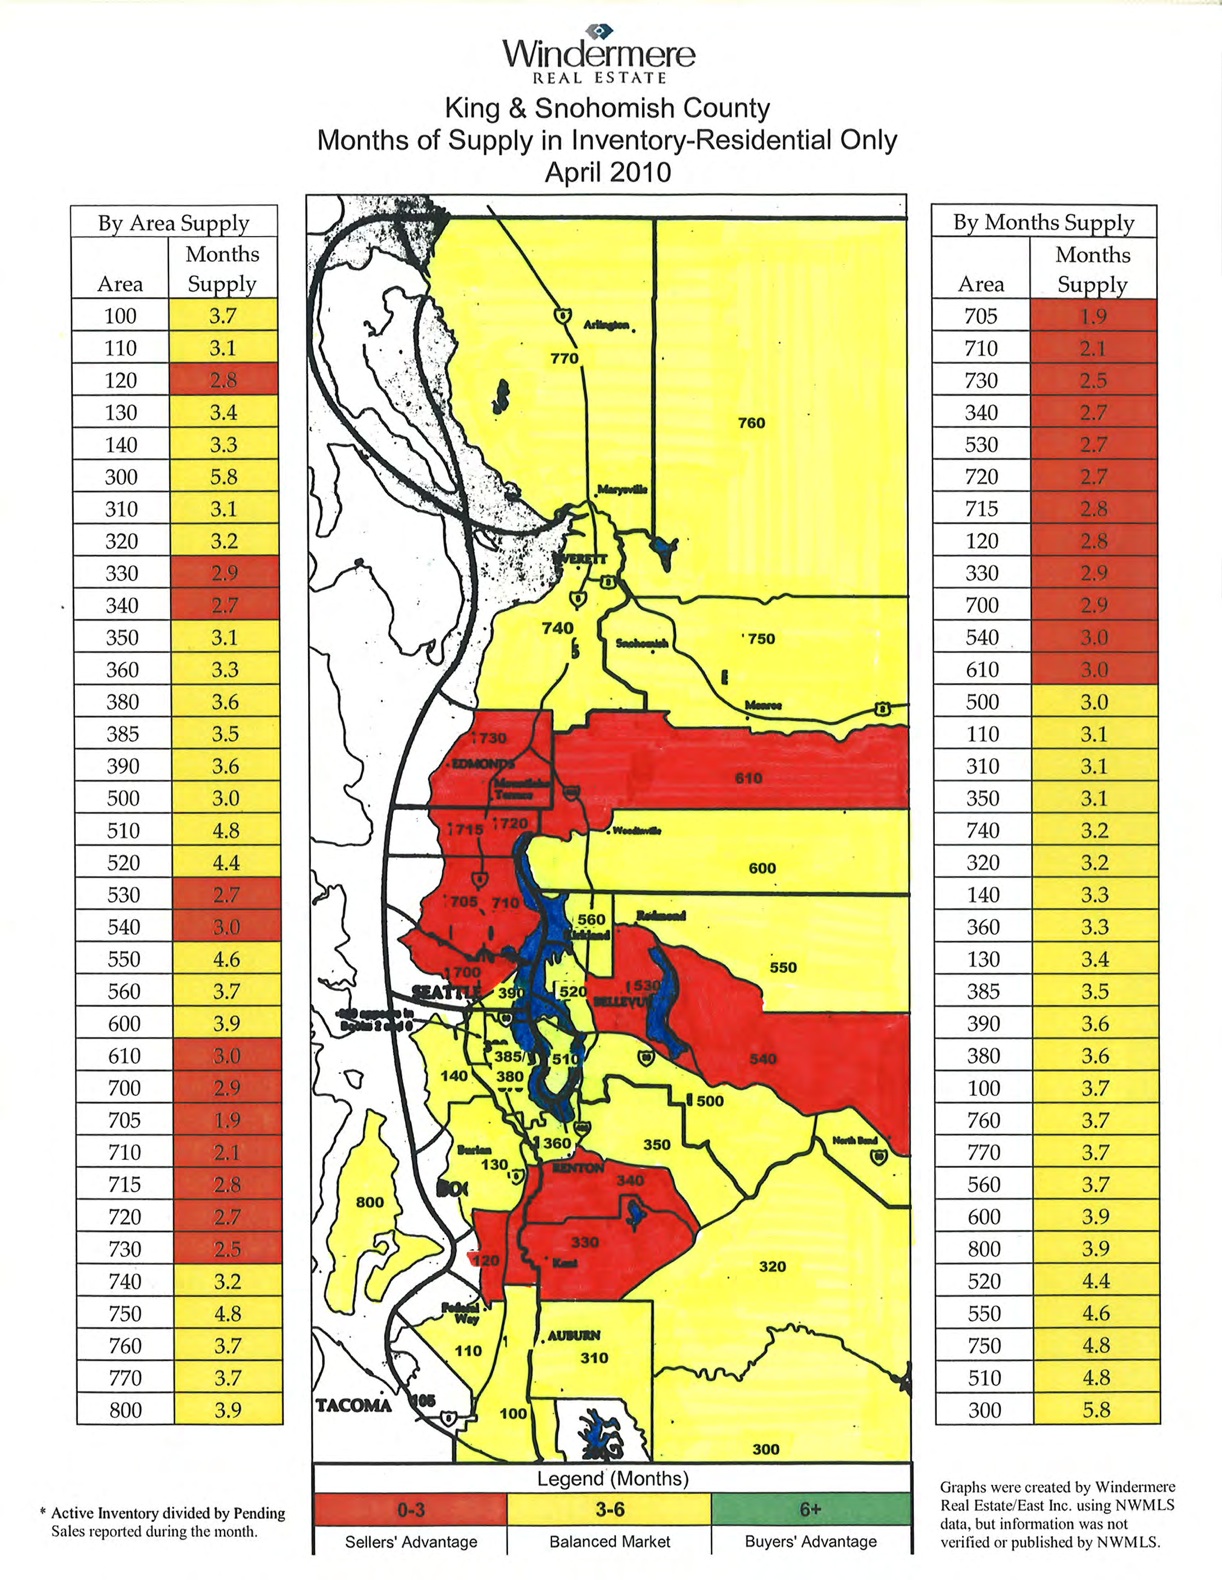
There were no sellers’ market in July. “Red” indicates a sellers’ market with homes selling in less than 3 months.  If you look at the map above, all  the Seattle markets are either a buyer’s market or a balanced market between buyers and sellers.

There’s a mix on Seattle’s eastside. Some markets are buyers’ markets such as West Bellevue and the Sammamish plateau cities of Sammamish, North Bend, Preston, and Fall City.  Homes in these real estate markets took on average over 6 months to sell.  The majority of Seattle Eastside real estate was a balanced market with homes selling between 3-6 months.

The state of the real estate market is a huge contrast from just three months ago when there was no “green” on the map at all.

King Snohomish Counties Real Estate Market 4-30-10

Clearly, the tax credit did its magic during that time. Is it the economy, job situation or is it the lack of urgency with interest rates slated to be low for a long time that is keeping buyers from making a home purchase?  I’ve heard opinions about all three reasons as the cause for the slow moving real estate market.  What do you think?

__________________________________________________________________________________

What do the numbers on the map mean?

The map is divided into the numbered areas as defined by our Northwest Multiple Listing Service (NWMLS).  Downtown Bellevue is area 520 and East Bellevue is area 530, as an example.

What do the colors mean?

Red means it’s a sellers’ market, a sellers’ advantage.

Yellow means a balanced market between buyers and sellers.

Green means it’s a buyers’ market.

If you take each area as shown on the map and look to the area number on the side of the map, it will tell you how long it would take to sell every home currently for sale if no other home came up on the market in that area.