Bellevue Real EstateFor BuyersFor SellersIssaquah Real EstateKing County Real EstateKirklandMarket StatisticsReal EstateRedmondSammamish, WA Real EstateSeattle real estateWoodinville, WA Real Estate June 10, 2010

How Did May, 2010 Seattle-Eastside Real Estate Sales Stack Up in Your Neighborhood

[googlemaps http://maps.google.com/maps?source=s_q&hl=en&geocode=&q=Seattle-eastside&sll=47.709762,-122.011414&sspn=0.310487,0.911865&ie=UTF8&split=1&radius=21.22&rq=1&ev=zo&hq=Seattle-eastside&hnear=&ll=47.709762,-122.011414&spn=0.310487,0.911865&t=h&output=embed&w=425&h=350]

How did May, 2009 stack up to May, 2010 in your neighborhood?

(Click on the cities below to see real estate trends for the past 5 years.  You’ll find the median pricing for each city and whether the number of homes for sale and the number of sales went up or down.  The odds of selling a home in each area is a result of the number of homes for sale divided by the actual number of home sales.)

The plateau:  Sammamish, Issaquah, North Bend, and Fall City

The odds of selling a home were 20.5%.

Median sales price increased from $524,950 to $559,880.

The number of homes for sale dropped by 20% and sales were up by 6% from last year.

West Redmond/East Bellevue

The odds of selling a home were 18%.

Median sales price dropped from $515,000  to $480,000.

The number of homes for sale dropped by 10% and sales were down by 7.5%.

South Bellevue/Issaquah

The odds of selling a home were 16%.

Median price increased to $624,975 from $619,000.

The number of homes for sale dropped by 19% and sales were down by 6%.

Woodinville/Bothell/Kenmore/Duvall/North Kirkland

The odds of selling a home were 12%.

Median price decreased to $451,126 from $459,500.

The number of homes for sale declined by 8% and sales were down by 22%.

Kirkland

The odds of selling a home were 15%.

Median price decreased to $599,000 from $599,950.

The number of homes for sale declined by 25% and sales were up by 3%.

West Bellevue

The odds of selling a home were 19%.

Median pricing was up from $1,097,000 to $1,280,000.

The number of homes for sale decreased by 23% and sales decreased by 12.5%.

Redmond/Education Hill/ Carnation

The odds of selling a home were 15.5%

Median pricing decreased from $569,895 to $519,950.

The number of homes for sale decreased by 17% and sales decreased by 18%.

When compared to May, 2009, only one area of Seattle’s eastside showed an increase in median prices.  West Bellevue had the highest with a 17% increase in sales prices. Last month the area had the most significant decrease in pricing. The return of some strength to the high end market is a good sign.  The high end was the least affected by the tax credit.

Most other Seattle-eastside neighborhoods experienced a reduction in sales prices.

Home sales also took a dip in most areas of the eastside.  Two areas, Kirkland and the plateau area of Sammamish, had increased home sales, but only in the single digits.

Seventeen percent less homes are for sale on the eastside this year than last year.

Has your area seen a drop in home sales since the expiration of the tax credit?

Bellevue Real EstateBellevue, WAFor BuyersFor HomeownersFor SellersIssaquah Real EstateKing County Real EstateKirklandMarket StatisticsReal EstateReal Estate NewsRedmondSammamish, WA Real EstateSeattle real estateWA real estateWindermere Real EstateWoodinville, WA Real Estate June 10, 2010

What Were The Odds of Selling Your Seattle-Eastside Home in May, 2010?

Seattle-Eastside Home Sales Activity, May, 2010

Seattle-Eastside Real Estate Sales, May 2010

The odds of selling a home on the Eastside in May, 2010 ranged from a low of 12% to a high of 20%, with an average 16.5% absorption rate.  Contrast this with April, 2010 odds with a low of 20% to a high of 35%, averaging a 27% absorption rate.

May’s numbers look more like May of last year than they do of April of this year.  This month may mark the back to reality of Seattle-eastside real estate or maybe not.  We’ll need to see how the rest of the year plays out as so many people rushed to buy and sell before the end of the tax credit.  There are still  buyers who want to buy and the sellers who need to sell, although this may be a time of adjustment.

(The absorption rate is the number of homes for sale in any given month divided by the actual number of homes sold that month.)

May, 2010               3209 homes for sale     529 homes sold              16.5% odds of selling.

April, 2010              3084 homes for sale     770 (was 847) homes sold      25%(was 27.5%) odds of selling.*

May, 2009               3841 homes for sale      547  homes sold         14% odds of selling.

*Adjusted from previous month’s numbers to reflect the actual number of homes sold and closed. Each month some sales  fall apart and don’t close.  A lower number of home sales may be reported at a later date to show the actual number of sales that did close.

_____________________________________________________________

May, 2009 Seattle-Eastside real estate market compared to May, 2010:

  • We are back to reality with Seattle-Eastside home sales.  The tax stimulus pushed both home buyers and sellers to act more quickly this year, so the high number of home sales in April may have contributed to the drop in number of eastside home sales in May.
  • The end of the tax stimulus had a greater impact on lower priced homes compared to higher priced homes.
  • The average list price of properties that are pending went from $512,060 to $646,545. This is an unprecedented change month to month.
  • As of this past week, there are 13,615  King County homes (houses and condos) for sale.
  • The median price was down by .9%, an insignificant drop.
  • Home sales on Seattle’s Eastside:   down 7%  The first down month in 2010.
  • Number of homes for sale on Seattle’s Eastside:  down 17%

Best odds of selling: Sammamish plateau areas of Sammamish, Issaquah, North Bend, and Fall City  with the best odds of selling as 20.5% of the Sammamish homes got offers.  

Worst odds of selling: Woodinville, Bothell, Kenmore, Duvall, and North Kirkland with 12% of the homes getting accepted offers.

Biggest increase in sales from last year: A small 6% increase in Sammamish home sales was the highest increase in Seattle-eastside real estate sales.  Quite a contrast to the double and triple digit increases we’ve seen the last few months.  As an example, there was 102% increase in the number of Kirkland homes sold in April, 2010 when compared to April, 2009.

Smallest increase in sales from last year: Kirkland home sales increased by 3%

Decline in real estate sales from last year: There was a decline in 5 out of the 7 Seattle-eastside areas, unlike the last few months when every eastside neighborhood experienced an increase in home sales. Redmond and Carnation had the largest decline in home sales with an 18% decline in the number of homes sold.

The peak of homes for sale in 2008: July,  4370 homes.

The peak of homes for sale in 2009: June,  3859 homes.

The number of eastside homes for sale at the start of 2010: 2584 homes

The number of eastside homes for sale now: 3209 homes.

Rate of home sales that failed and did not close: 10%

Seattle Eastside real estate tends to slow down a bit when the sun comes out, which hopefully is any day now!  The number of home sales could remain on the lower side in the near future for two reasons.  One is the slow down after the tax credit rush which we are now seeing and the upcoming (think positively) sunny weather and summer vacations.  People in Seattle like to play outside in the sun.  There are a number of people who are “gearing up” to make a move, so we may see stronger eastside real estate sales when summer comes to an end.

Ironically, when people ask me when is the best time time to sell a home, I tell them spring and fall are usually the best times.  However, homes sell each month and the ones that show the best and are priced competitively will be the ones to get the offer.

Bellevue Real EstateFor BuyersFor HomeownersFor SellersMake More Money Selling Your HomeReal EstateReal Estate OpinionSeattle real estate June 7, 2010

Make More Money Selling Your Home, Part 6, Replace Your Carpet

Mr and Mrs. Home Seller ask: “Why don’t we let the buyers pick out the new carpet?  We don’t know what color they may want.”

New carpeting updates a home

New carpeting Creates a Fresh, Clean Look

This is one of the most common sentiments I’ve heard over the years from home sellers.  Sellers often think it’s best to leave the old carpet, offer a carpet allowance if needed, and let the buyer choose their own carpet.

Is this right?  Do buyers want to choose their own carpet?

NO.  Not in the Seattle-Eastside real estate market.  Buyers DO NOT want to choose, pay or replace carpet when buying a new home.  In this area, Seattle’s eastside cities of Bellevue, Redmond, Kirkland, and Issaquah, etc., buyers want to buy a home that’s move-in ready.

On Seattle’s eastside,  the typical buyer is a very busy person(s) who may work a lot of hours.  Most buyers aren’t looking to do structural or cosmetic updates to a home. They don’t have the time or the inclination. They want to move in and continue on with their lives with the least amount of disruption. They don’t want to be replacing carpet. Besides, there are lots of Seattle-eastside homes to choose from and many of the other homes have been updated and are ready to go.

Most home sellers don’t want to replace carpet either, but think about it.  The buyers don’t have to replace your carpet because they don’t have to buy your home.  They have other homes to buy.  However, as the seller, you have only one home to sell and so you’ve got to do it.   Remember, if you feel like you don’t want to replace the carpet, the buyer probably feels the same way. The catch is, they don’t have to do it, they can buy another home.

So if you want to get an offer to buy your home and make the most money while selling your home, replace your carpet if it’s worn, discolored, has stains, you name it.  Make sure it looks fresh and clean, otherwise it will cost you money in the sales price for your home and it could even cost you getting a buyer.

Should you spend a lot for expensive carpet?  Absolutely not. You should put in a good grade of carpet, but one that is similar to what builders install in new construction.  Make sure you pick a neutral color and install a good 8 lb. pad underneath the rug. A thin pad with new carpet won’t work.  It’s easy to tell that either the carpet or the pad are thin the minute you step on it. It feels like you’re on cement.

Looking for some other tips to get the most money when selling your home? Read Parts 1-5, planting some “green,” when to set the sales price, yard clean up dressing up a front door, and replacing moldings and doors.  Pick what your home needs to get it “dressed up” to sell in the competitive Seattle real estate market.

For BuyersFor SellersReal EstateReal Estate News June 4, 2010

Are You Painting or Remodeling? New Lead Paint Laws For Homes Built Before 1978

Was your home built before 1978? If so, then if you do any painting or remodeling you or your contractor have to follow new federal guidelines for painting and renovating homes built before 1978. From The Wall Street Journal:

As of late last month, businesses that repair or renovate older buildings—specifically homes, schools and daycare centers built before the federal government banned the use of lead-based paint in housing in 1978—are required by the U.S. Environmental Protection Agency to adhere to strict lead-safe work practices. To comply with the new regulation, those working on older sites will need to invest in lead-testing kits, plastic sheeting, respirators, protective clothing and other lead-safety materials.

This also is straight from the EPA website.

For BuyersFor SellersMarket StatisticsReal EstateSeattle real estateWindermere Real Estate May 27, 2010

Do You Want to List Your Home or Get It Sold?

“Can I start out pricing my home higher and then come down in price?” This is one of the most common questions I get asked by people planning to sell their home.

Statistics from March Seattle-eastside home sales show a home will sell faster and for a better price if priced correctly to start.  Overpricing a home can result in a longer market time and a lower price.

Getting Your Home Sold

Moving Your Home From "For Sale" to Sold

So do you want to start with a higher asking price and come down? If you’re serious about selling your home, price it right, otherwise you risk putting a “for sale” sign in your yard, but not selling your home.

What do you think?

Bellevue Real EstateFor BuyersFor SellersIssaquah Real EstateKing County Real EstateKirklandReal EstateRedmondSammamish, WA Real EstateWindermere Real EstateWoodinville, WA Real Estate May 20, 2010

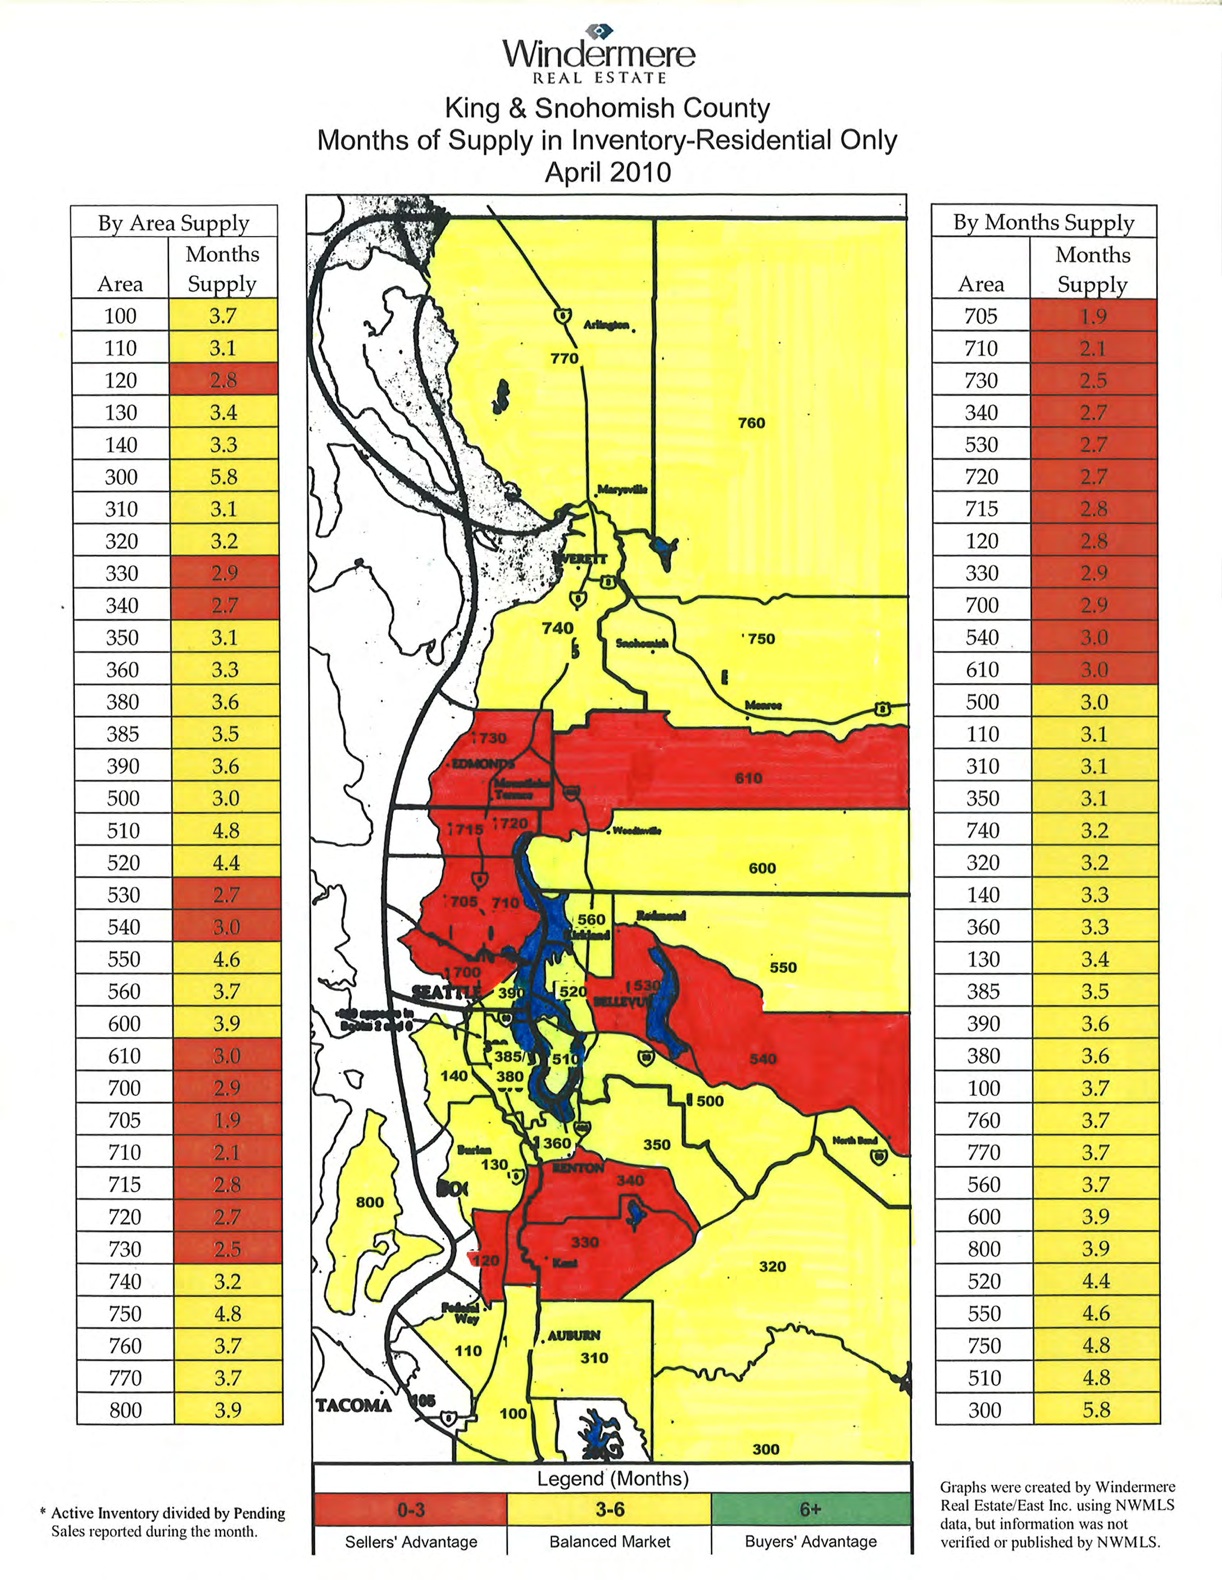
There's No Green on The Seattle-Eastside Real Estate Map April, 2010

King Snohomish Counties Real Estate Market 4-30-10

What do the numbers on the map mean?

The map is divided into the numbered areas as defined by our Northwest Multiple Listing Service (NWMLS).  Downtown Bellevue is area 520 and East Bellevue is area 530, as an example.

What do the colors mean?

Red means it’s a sellers’ market, a sellers’ advantage.

Yellow means a balanced market between buyers and sellers.

Green means it’s a buyers’ market.

If you take each area as shown on the map and look to the area number on the side of the map, it will tell you how long it would take to sell every home currently for sale if no other home came up on the market in that area.

The first time in years, literally, that there were no buyers’ markets on the King-Snohomish County, Washington map of real estate.  Last month, there was one area, Vashon Island, which is now coming up as a balanced market.

The two hottest selling markets on the eastside in April, 2010?

The first is Redmond, near Microsoft, East Bellevue and the second is the plateau area which includes Sammamish, parts of Issaquah, North Bend, and Fall City.

Bellevue Real EstateIssaquah Real EstateKirklandReal EstateRedmondSammamish, WA Real EstateWoodinville, WA May 17, 2010

What Were The Odds of Selling Your Seattle-Eastside Condo in April, 2010?

Condo Sales on Seattle's Eastside

Seattle - Eastside Condo Sales April 2010

(The absorption rate, the percentage of condos selling, is the number of condos for sale in any given month divided by the actual number of condos sold that month.  So if the absorption rate or chance of selling is 10% that means out of 100 condos for sale, 10 received offers and sold.)

April, 2010                  1437 condos for sale       316 condos sold,            22% odds of selling.

March, 2010                1356 condos for sale,    241 (was 281) condos sold,     18% (was 21%) odds of selling.*

April, 2009                  1315 condos for sale     155  condos sold,           12% odds of selling.

*Adjusted from previous month’s original numbers to reflect the actual number of condos sold and closed.  Some of the sales originally reported last month failed and did not close. Seventeen percent of condo sales originally reported in March failed to close.  Some of the reasons sales fail are the buyer and seller don’t agree on the building inspection, the condo does not appraise for the sales price or the buyer’s financing does not come through.

Seattle-eastside condo sales were popping the past two months with the strongest sales seen in years.  With the 2010 tax credit behind us, we should continue to see people who need to make a move out there buying and selling their home.  We may see a little of a lull in Seattle area condo sales, but I expect condo sales to get back to business as usual.

Bellevue Real EstateIssaquah Real EstateKirklandReal EstateSammamish, WA Real EstateSeattle real estateWoodinville, WA May 14, 2010

How Did April, 2010 Home Sales Stack Up in Your Seattle-Eastside Neighborhood?

[googlemaps http://maps.google.com/maps?source=s_q&hl=en&geocode=&q=Seattle-eastside&sll=47.709762,-122.011414&sspn=0.310487,0.911865&ie=UTF8&split=1&radius=21.22&rq=1&ev=zo&hq=Seattle-eastside&hnear=&ll=47.709762,-122.011414&spn=0.310487,0.911865&t=h&output=embed&w=425&h=350]

How did April, 2009 stack up to April, 2010 in your neighborhood?

(Click on the cities below to see real estate trends for the past 5 years.  You’ll find the median pricing for each city and whether the number of homes for sale and the number of sales went up or down.  The odds of selling a home in each area is a result of the number of homes for sale divided by the actual number of home sales.)

The plateau:  Sammamish, Issaquah, North Bend, and Fall City

The odds of selling a home were 31%.

Median sales price dropped from $524,000 to $514,950.

The number of homes for sale dropped by 20% and sales were up by 75% from last year.

West Redmond/East Bellevue

The odds of selling a home were 35%.

Median sales price dropped from $500,000  to $450,000.

The number of homes for sale dropped by 2% and sales were up by 57%.

South Bellevue/Issaquah

The odds of selling a home were 34%.

Median price decreased to $599,900 from $649,000.

The number of homes for sale dropped by 21% and sales were up 23%.

Woodinville/Bothell/Kenmore/Duvall/North Kirkland

The odds of selling a home were 26%.

Median price increased to $409,500 from $399,950.

The number of homes for sale declined by 12% and sales were up by 18%.

Kirkland

The odds of selling a home were 22%.

Median price decreased to $575,000 from $649,000.

The number of homes for sale declined by 23% and sales were up by 102%.

West Bellevue

The odds of selling a home were 20%.

Median pricing was down from $1,100,000 to $849,000.

The number of homes for sale decreased by 27% and sales increased by 62%.

Redmond/Education Hill/ Carnation

The odds of selling a home were 23%

Median pricing decreased from $554,950 to $514,995.

The number of homes for sale decreased by 11% and sales increased by 32%.

When compared to April, 2009, only one area of Seattle’s eastside showed an increase in median prices.  This area encompasses Woodinville, Bothell, Kenmore, and Duvall.

The most significant decrease in pricing was in West Bellevue, just like last month. Home values in West Bellevue dropped by 23%.  The other Seattle-eastside neighborhoods experienced a reduction in sales price, but not by as much.

Home sales, on the other hand, continued to be strong all over the eastside.  Sales increases ranged from 18% in the Woodinville area to 102% in Kirkland, the only area with a triple digit increase in home sales this month.

Eighteen percent less homes are for sale on the eastside this year than last year.

What’s happening in your area?  Are home sales strong?  Do you expect it to continue?

Bellevue Real EstateFor BuyersFor SellersIssaquah Real EstateKirklandReal EstateRedmondSammamish, WA Real EstateWoodinville, WA Real Estate May 14, 2010

What Were The Odds of Selling Your Seattle-Eastside Home in April, 2010?

Real Estate Sales in Seattle-Eastside

Seattle-Eastside Real Estate Sales April 2010

The odds of selling a home on the Eastside in April, 2010 ranged from a low of 20% to a high of 35%, with an average 27% absorption rate. (The absorption rate is the number of homes for sale in any given month divided by the actual number of homes sold that month.)

April, 2010                3084 homes for sale       847 homes sold        27.5% odds of selling.

March, 2010             2923 homes for sale      695 (was 778)  homes sold    24% (was 27%) odds of selling.*

April, 2009               3600 homes for sale      477  homes sold         13% odds of selling.

*Adjusted from previous month’s numbers to reflect the actual number of homes sold and closed. Each month some sales  fall apart and don’t close.  A lower number of home sales may be reported at a later date to show the actual number of sales that did close.

_____________________________________________________________

April, 2009 Seattle-Eastside real estate market compared to April, 2010:

  • Home sales continued on a roll in all Seattle-Eastside cities.
  • As of this past week, there are 13,102  King County homes (houses and condos) for sale.
  • Overall, the Seattle eastside number of homes for sale continues to rise as the year progresses with only a few dips in numbers for sale since the first of the year.
  • The median price was down by 5%.  (Keep in mind this is comparing last April’s numbers to this April and is not an indication of the total drop in price for the year.)
  • Home sales on Seattle’s Eastside:   up 47%!
  • Number of homes for sale on Seattle’s Eastside:  down 18%

Best odds of selling: Redmond, near Microsoft, and East Bellevue with the greatest odds of selling as 35%  of the homes got offers.  

Worst odds of selling: West Bellevue, with 20% of the homes getting accepted offers.

Biggest increase in sales from last year: There was 102% increase in the number of Kirkland homes sold this April than last April.  Kirkland was the only area with a triple digit increase this month.

Smallest increase in sales from last year: Woodinville, Bothell, Kenmore, Duvall with an 18% increase in home sales over last year.

Decline in real estate sales from last year: None on the eastside. More homes sold in all areas of Seattle’s eastside this April than April, 2009.

The peak of homes for sale in 2008: July,  4370 homes.

The peak of homes for sale in 2009: June,  3859 homes.

The number of eastside homes for sale at the start of 2010: 2584 homes

The number of eastside homes for sale now: 3084 homes.

Rate of home sales that failed and did not close: 13%

Seattle Eastside home sales should continue to be strong in May.  My team and I are getting phone calls from both buyers and sellers who still want to make a move, but may have not been ready to do so simply for the tax credit.

What’s happening in real estate in your area?  Are homes selling?  Do you think you’ll see a change in real estate because the tax credit is gone?

For HomeownersFor SellersReal EstateRemodeling and style trendsSeattle real estate May 12, 2010

Make More Money Selling Your Home, Part 5, Moldings and Doors

Make more money selling your home is my series on getting your home sold, not just getting it ready to sell, but getting it sold. These posts are a series of suggestions for things you can do to update your home before you sell it.  Updated homes sell faster and for more money than homes in need of work. Better yet, if you want to do some of these things while you’re still enjoying your home, go for it.

You may not do everything, but if you read all the posts, you’ll have a good idea of what home updates will get you more money. You can decide how best to spend your money and what works for your budget.  Read Parts 1-4, planting some “green,” when to set the sales price, yard clean up, and dressing up a front door and the rest of the series (coming soon), to pick what your home needs to get it “dressed up” to sell in the competitive Seattle real estate market.

Spending some money updating your home will help you make more money selling your home.  In the Seattle real estate market, particularly on the eastside, most buyers are looking for homes updated and ready to go. There’s a very small pool of buyers looking to fix up a home on Seattle’s eastside.

Today’s topic:  moldings and doors. Clean, fresh white moldings and doors.  Some homes will have a theme and look better with wood doors and moldings, but many homes will look great with white woodwork.  If you’re starting from scratch, you can pick from many different door styles.  In today’s home market, doors can be anywhere from two to 6 panel, with the two panel doors growing in popularity.

New Doors Dress Up a Home for Sale

New Doors Dress Up a Home for Sale

Before you pick the style of door, think about the type of neighborhood where your home is located. If it’s an upscale, high-end neighborhood, buyers will expect top quality.  You’ll throw your money out if you go with inexpensive finishes.  If the home is situated in a starter neighborhood, then go with hollow core doors, so you’ll save money.  Solid doors are far more expensive.   Pick something simple that matches your decor.  Be practical and spend the least amount of money, while getting something that looks good and is the quality to fit your neighborhood and style of your home.

Moldings:  Does your home have those skinny, outdated flat moldings from the 60’s or the 70’s?  If so, it’s time for a change.  Go with thicker baseboard moldings to dress up a room.  Moldings finish a room off, making the overall finished look richer and better. Again, keep it simple and buy pre-painted moldings, if available.

Updating Moldings in a Home

Thick Baseboards Add A Quality Look to a Home

For the high-end neighborhood, maybe it’s repainting existing moldings so they look fresh and clean.  Maybe it’s adding more crown moldings or chair rails in different parts of the house.

Dressing Up a Room By Adding Chair Rails

Dressing Up a Room By Adding Chair Rails

Don’t have the money to replace all the doors and moldings? Then paint them white, so they look fresh and clean.    Make sure to use the right painting tools and paint. If you’ve never painted doors and moldings, then find out how to paint them so the surfaces will be smooth.  Use a semi-gloss paint and it will help make the moldings pop.  It will also help keep the moldings clean when done.

If painting is not your thing,  it’s probably better to hire someone who knows how to paint these surfaces.  Again, don’t throw your time and money out by doing a poor paint job.

Whatever your budget allows, the doors and moldings should be fresh and clean when you sell your home.  If they’re not, it will cost you time and money in the sale of your home.

Do you have any other ideas about making doors and moldings look good?