
 Facebook
 X
X
 Pinterest
 Copy Link
"Green" is Back on the Seattle-Eastside's Real Estate Map, May, 2010

Home Sales Activity for King and Snohomish Counties, May, 2010
During May “green” crept back into a number of Seattle areas. One large area on the eastside, Woodinville, Bothell, Kenmore, Duvall, and north Kirkland was “green,” back as a buyer’s market.
April was the first month in a very long time in which there was no ” green,” no buyers’ markets in almost all the Seattle-eastside areas. In April, the Seattle area real estate market was the strongest in years. This is most likely a direct result of the 2010 tax credit. Both buyers and sellers were rushing to buy and sell before the expiration of the credit.
May represented a lull in the Seattle real estate market. Was this a temporary lull or our new normal? The next several months will be good indicators, although summer tends to be a slower time every year in Seattle real estate. Home buyers and sellers are like everyone else. Seattleites play outside in summer. Of course, that’s providing the sun ever comes out this year!
The good real estate news is there are still great homes and condos out there to buy and interest rates are at historic lows. The loss of the tax credit may not make much of a difference when calculating the savings in monthly payments over time.

Interest Rates 6-2010
It may be the fall before we can determine the true pace of Seattle real estate. I’ll keep you posted.

- King Snohomish Counties Real Estate Market 4-30-10
What do the numbers on the map mean?
The map is divided into the numbered areas as defined by our Northwest Multiple Listing Service (NWMLS). Downtown Bellevue is area 520 and East Bellevue is area 530, as an example.
What do the colors mean?
Red means it’s a sellers’ market, a sellers’ advantage.
Yellow means a balanced market between buyers and sellers.
Green means it’s a buyers’ market.
If you take each area as shown on the map and look to the area number on the side of the map, it will tell you how long it would take to sell every home currently for sale if no other home came up on the market in that area.
There's No Green on The Seattle-Eastside Real Estate Map April, 2010
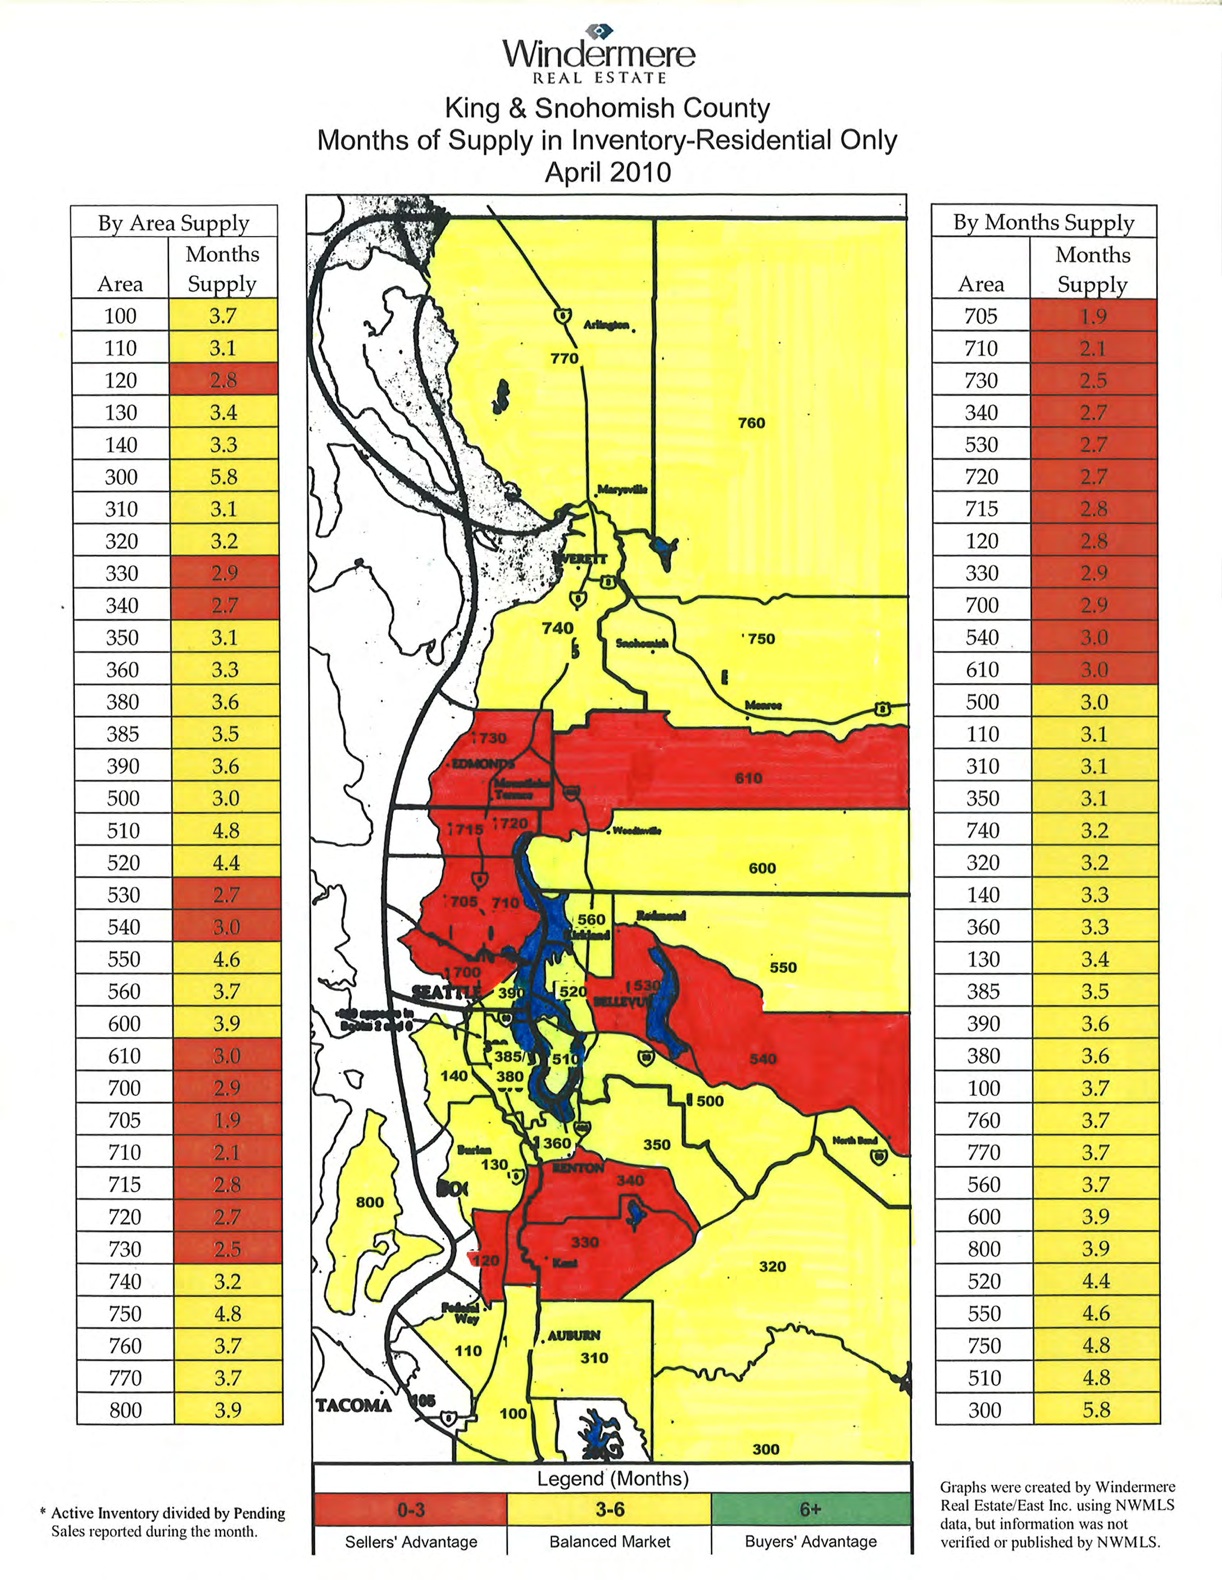
King Snohomish Counties Real Estate Market 4-30-10
What do the numbers on the map mean?
The map is divided into the numbered areas as defined by our Northwest Multiple Listing Service (NWMLS). Downtown Bellevue is area 520 and East Bellevue is area 530, as an example.
What do the colors mean?
Red means it’s a sellers’ market, a sellers’ advantage.
Yellow means a balanced market between buyers and sellers.
Green means it’s a buyers’ market.
If you take each area as shown on the map and look to the area number on the side of the map, it will tell you how long it would take to sell every home currently for sale if no other home came up on the market in that area.
The first time in years, literally, that there were no buyers’ markets on the King-Snohomish County, Washington map of real estate. Last month, there was one area, Vashon Island, which is now coming up as a balanced market.
The two hottest selling markets on the eastside in April, 2010?
The first is Redmond, near Microsoft, East Bellevue and the second is the plateau area which includes Sammamish, parts of Issaquah, North Bend, and Fall City.
Seattle-Eastside Real Estate is Beginning to Turn Red
Seattle-eastside real estate is starting to see “red.” Red is a sellers’ market, which means the average market time to sell a Seattle eastside home in the areas marked in red is from 3-6 months.
I sell a lot homes in the “hottest Seattle eastside area, which we call area 530, East Bellevue and the Redmond neighborhoods around Microsoft. Homes sales were hopping this past month, with sales often happening in two weeks or less. If you live in any of the areas marked in “red” and your home is not selling, it’s priced too high compared to competition. If your home is overpriced, you’re helping to sell other homes and they’re selling at your expense.
Seattle proper remains the “hottest” area overall, but if you’re looking to buy on the eastside, all the areas are either a real estate market that’s balanced between buyer and seller (yellow) or in “red,” a sellers’ market.
Buyers markets were absent in March. There’s no green (for a buyers market) left on this map, with the exception of Vashon Island, so the buyers’ markets we’ve been experiencing over the last few years were no where to be seen in in March.
Will the map show the same colors next month? I believe April will also be a very strong month for Seattle-eastside real estate.

Which King/Snohomish County Areas Are Selling Faster?
What do the numbers on the map mean?
The map is divided into the numbered areas as defined by our Northwest Multiple Listing Service (NWMLS). Downtown Bellevue is area 520 and East Bellevue is area 530, as an example.
What do the colors mean?
Red means it’s a sellers’ market, a sellers’ advantage.
Yellow means a balanced market between buyers and sellers.
Green means it’s a buyers’ market.
If you take each area as shown on the map and look to the area number on the side of the map, it will tell you how long it would take to sell every home currently for sale if no other home came up on the market in that area.
King County WA has 3000 More Properties For Sale
King County has a lot more properties for sale than the first week of the year. The first quarter of 2010 has passed and there are now 24% more homes and condos for sale, exactly 3000 more. Each week of the year has seen an increase in the number of properties for sale with the exception of one week. Right now there are 12,726 properties for sale and we started the year with 9726 available properties in King County.
This is typical of the Seattle area real estate market. Each spring the number of properties for sale increases dramatically. The good news is most Seattle areas are experiencing a huge jump in real estate sales. But that’s for another post!

King County WA Real Estate 3-29-10
Seattle Eastside Real Estate Was "Normal" in February, 2010

King and Snohomish County WA Real Estate, February, 2010
The truly “hot” Seattle real estate areas in February, 2010, those in red, are in the core neighborhoods of Seattle itself. However, almost all of the map is in “yellow”, which means the average market time for a home to sell in other Seattle areas is between 3-6 months. This means we’ve had another month with a very balanced, “normal” Seattle real estate market. A normal real estate market is when supply and demand balance out to be 3-6 months to get a home sold. A balanced market is not a reflection of home values, but a reflection of the real estate sales activity.
On most of Seattle’s eastside, home prices are down, but sales have gone up dramatically, anywhere from 52% to 193%, depending on the neighborhood. Prices are lower in most eastside areas, fewer homes have been on the market compared to last year, and more homes are selling.
Will the colors on the Seattle real estate map stay the same in the coming months? It’s hard to answer this question now, but I do know the number of homes coming up for sale is growing pretty quickly. The increase in the number of Seattle-eastside homes and condos for sale could impact the total number of properties that sell and the market time to get a sale. With the April 30th deadline for the home buyer tax credit, much will depend on how many homes are on the market and the interest rates. Check my March eastside blog posts next month to find out what will happen.
What’s your prediction for Seattle-eastside real estate in the coming months? Will “yellow,” representing a balanced real estate market between home buyers and sellers still be the predominant color on the map?
———————————————————————————————————–
What do the numbers on the map mean?
The map is divided into the numbered areas as defined by our Northwest Multiple Listing Service (NWMLS). Downtown Bellevue is area 520 and East Bellevue is area 530, as an example.
What do the colors mean?
Red means it’s a sellers’ market, a sellers’ advantage.
Yellow means a balanced market between buyers and sellers.
Green means its a buyers’ market.
If you take each area as shown on the map and look to the area number on the side of the map, it will tell you how long it would take to sell every home currently for sale if no other home came up on the market in that area.
A Great Picture of Seattle Real Estate in January, 2010

King and Snohomish County Real Estate 1-31-10
There’s a “normal” real estate market in the Seattle area. What’s a normal real estate market? It’s a real estate market in which the market is evenly balanced between both buyers and sellers, which is a good thing.
Much like December, Seattle in January was “yellow,” on the map. “Yellow” means it would take 3-6 months to sell all of the available homes if no other homes come on the market. This is a good balance of homes for sale. Prices are still down and fewer homes are on the market than most of 2009, but more homes are selling.
Since it’s a normal real estate market, the best homes will “pop,” selling quickly while the overpriced homes will sit on the market through a price reduction or two before they sell or not sell at all. Some homes have sold in less than a week because they are great ones that are priced right and shine above the competition.
I’m seeing the extension of the 2010 home buyer credit continue to do its job of jump starting real estate sales. The first part of 2010 should be pretty active for both home buyers and sellers. After April 30th when the home buyer tax credit goes away, much will depend on how many homes are on the market and the interest rates.
What do the numbers on the map mean?
The map is divided into the numbered areas as defined by our Northwest Multiple Listing Service (NWMLS). Downtown Bellevue is area 520 and East Bellevue is area 530, as an example.
What do the colors mean?
Red means it’s a sellers’ market, a sellers’ advantage.
Yellow means a balanced market between buyers and sellers.
Green means its a buyers’ market.
If you take each area as shown on the map and look to the area number on the side of the map, it will tell you how long it would take to sell every home currently for sale if no other home came up on the market in that area.
2009 Ends With a More Balanced Real Estate Market Around Seattle

King-Snohomish County Real Estate December, 2009
December, 2009 Seattle real estate finished the year off on a more positive note. With so much of the Seattle area real estate market showing “yellow,” there was a solid return to a real estate market more evenly balanced between buyers and sellers. This is more like the real estate market we saw in the 1990’s.
There was still a significant increase in real estate sales from December, 2008, with West Bellevue leading the way on Seattle’s eastside. The number of West Bellevue home sales shot up by 279%! Because home prices in West Bellevue tend to be among the most expensive on Seattle’s eastside and in the Seattle area in general, this signaled more of return to confidence in the real estate market. Prices for high end homes have dropped to the point that buyers were more comfortable buying. Since most of these sales had nothing to do with the first time home buyer credit, this signaled a strong change in buyer confidence and willingness to buy.
Prices tended to be more reasonable all over the Seattle area. Lower prices, low interest rates, and the first time home buyers’ tax credit did a lot to open up the real estate market.
The year ended with the lowest number of homes on the market for all of 2009. The amount of properties for sale was similar to what was available in 2007. This does not mean the market will return to 2007 real estate activity, but it is a good thing to see that there were, and are, less properties for sale in the Seattle area.
What’s in store for 2010?
I expect the extension and expansion of the 2010 home buyer credit to continue to spur real estate sales on. I also expect it to bring more home sellers into the market, so competition could increase again. The number of properties for sale is a huge factor in pricing and market time. The first part of 2010 should be pretty active for both home buyers and sellers. After April 30th when the home buyer tax credit goes away, much will depend on how many homes are on the market and the interest rates.
As I’ve mentioned before, be prepared for any and everything with real estate sales in the coming months. There’s no “one size fits all.” Home sales will depend on the price point, location, the home’s condition, the competition, and/or a combination of these things. Some homes will sell quickly and for a good price, others will still undergo significant price reductions to meet market expectations, and others will sell, but for less than one would expect. This, actually, is what we expect to see in a normal, more balanced real estate market.
What do the numbers on the map mean?
The map is divided into the numbered areas as defined by our Northwest Multiple Listing Service (NWMLS). Downtown Bellevue is area 520 and East Bellevue is area 530, as an example.
What do the colors mean?
Red means it’s a sellers’ market, a sellers’ advantage.
Yellow means a balanced market between buyers and sellers.
Green means its a buyers’ market.
If you take each area as shown on the map and look to the area number on the side of the map, it will tell you how long it would take to sell every home currently for sale if no other home came up on the market in that area.
